Steps in this chapter (83)
Every report in BookTrove, in the order of the Reports page, with a one-line explanation. All were run for Savannah Harvest on 30 April 2026: period reports for 1 January to 30 April, as-at reports at 30 April. Each report can be exported to CSV, downloaded as PDF, printed and saved as a view; click an amount to see the transactions behind it.
Some reports are empty because nothing of that kind happened in the illustration (for example open quotes or impairments); they are shown so you know where to find them.
19.1 Profit and loss
Why
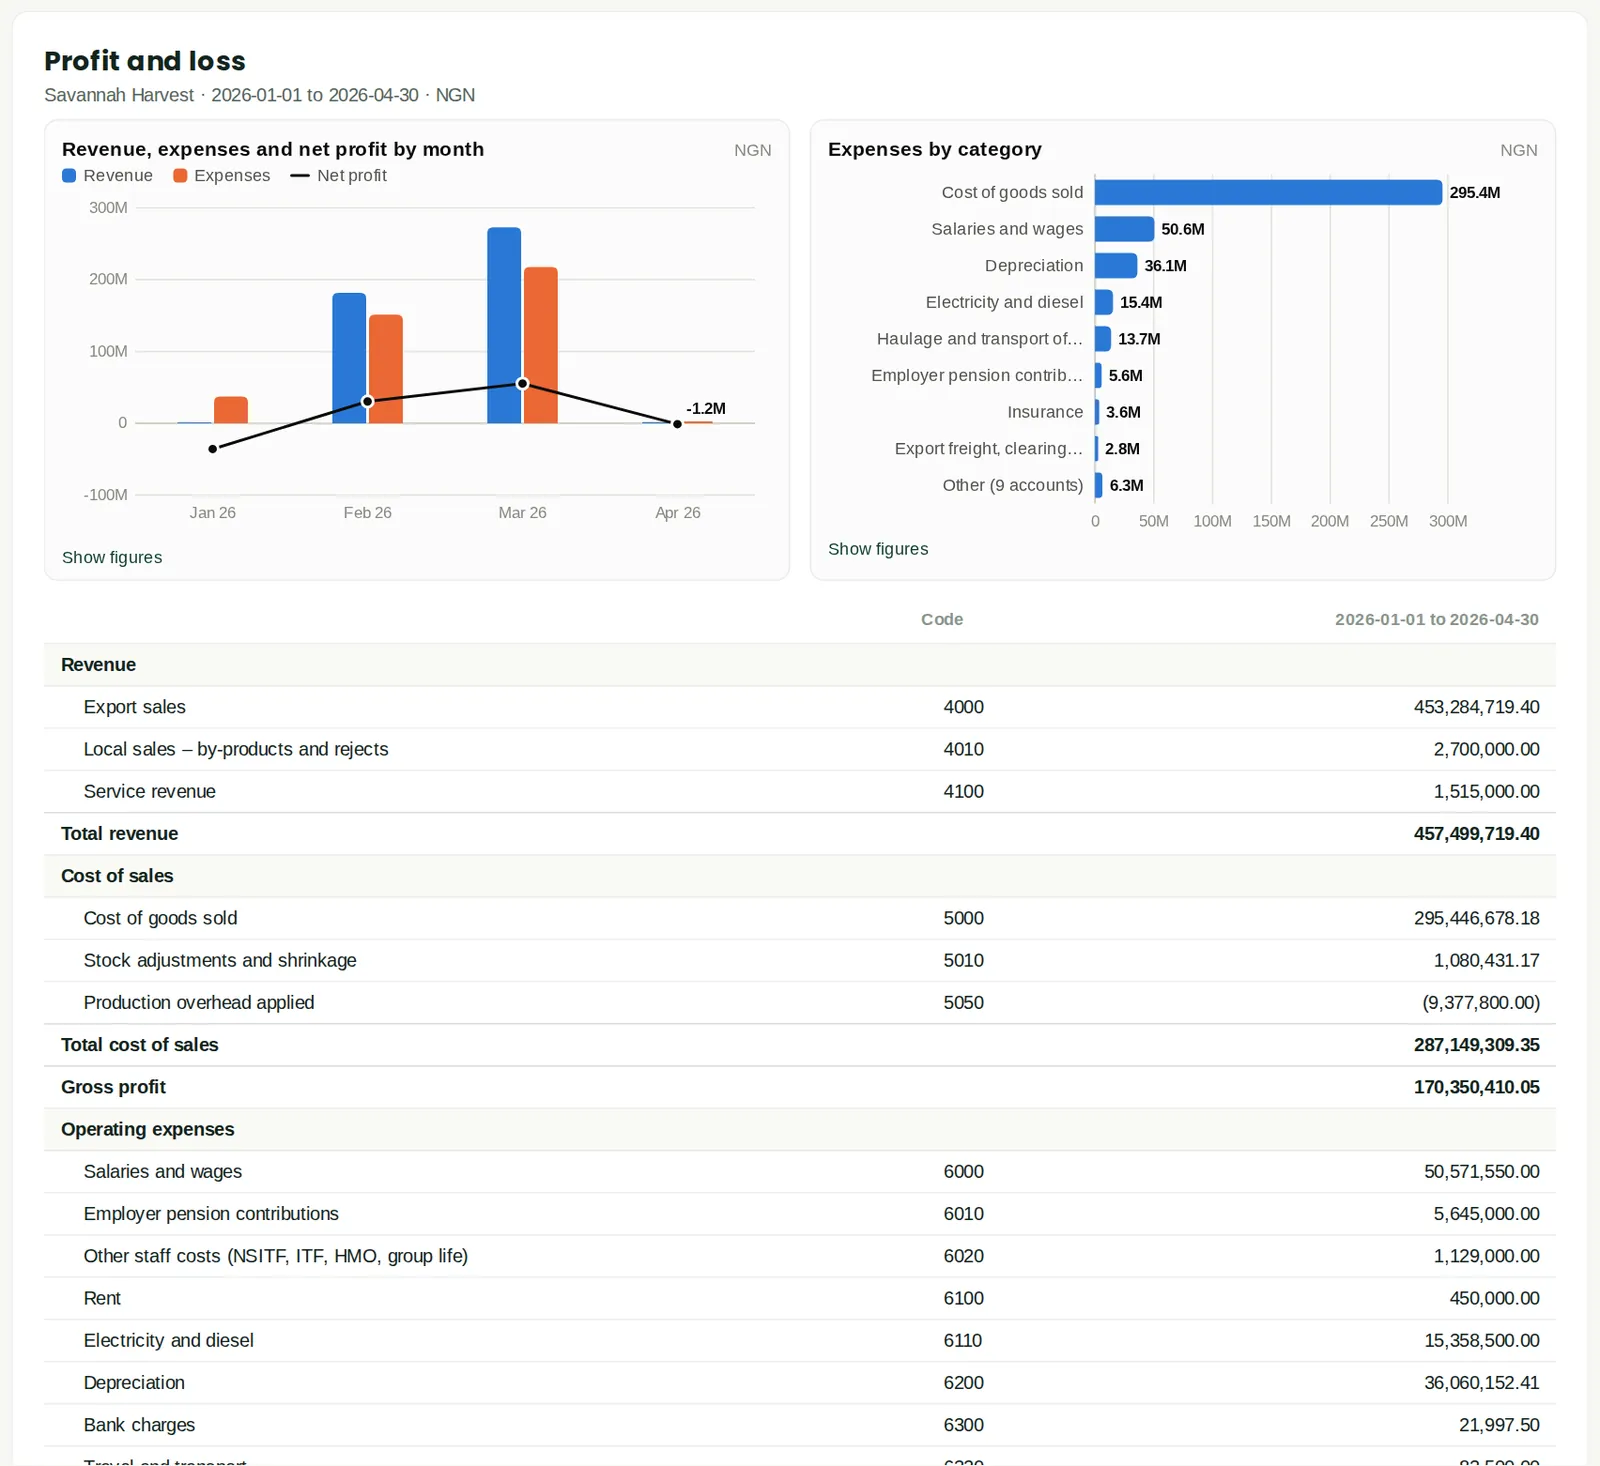
Statement of profit or loss — IAS 1, or IFRS 18 categories and subtotals from 2027 — with comparisons, months, quarters or tracking columns. Four months to 30 April, including the project revenue billed in April.
19.2 Balance sheet
Why
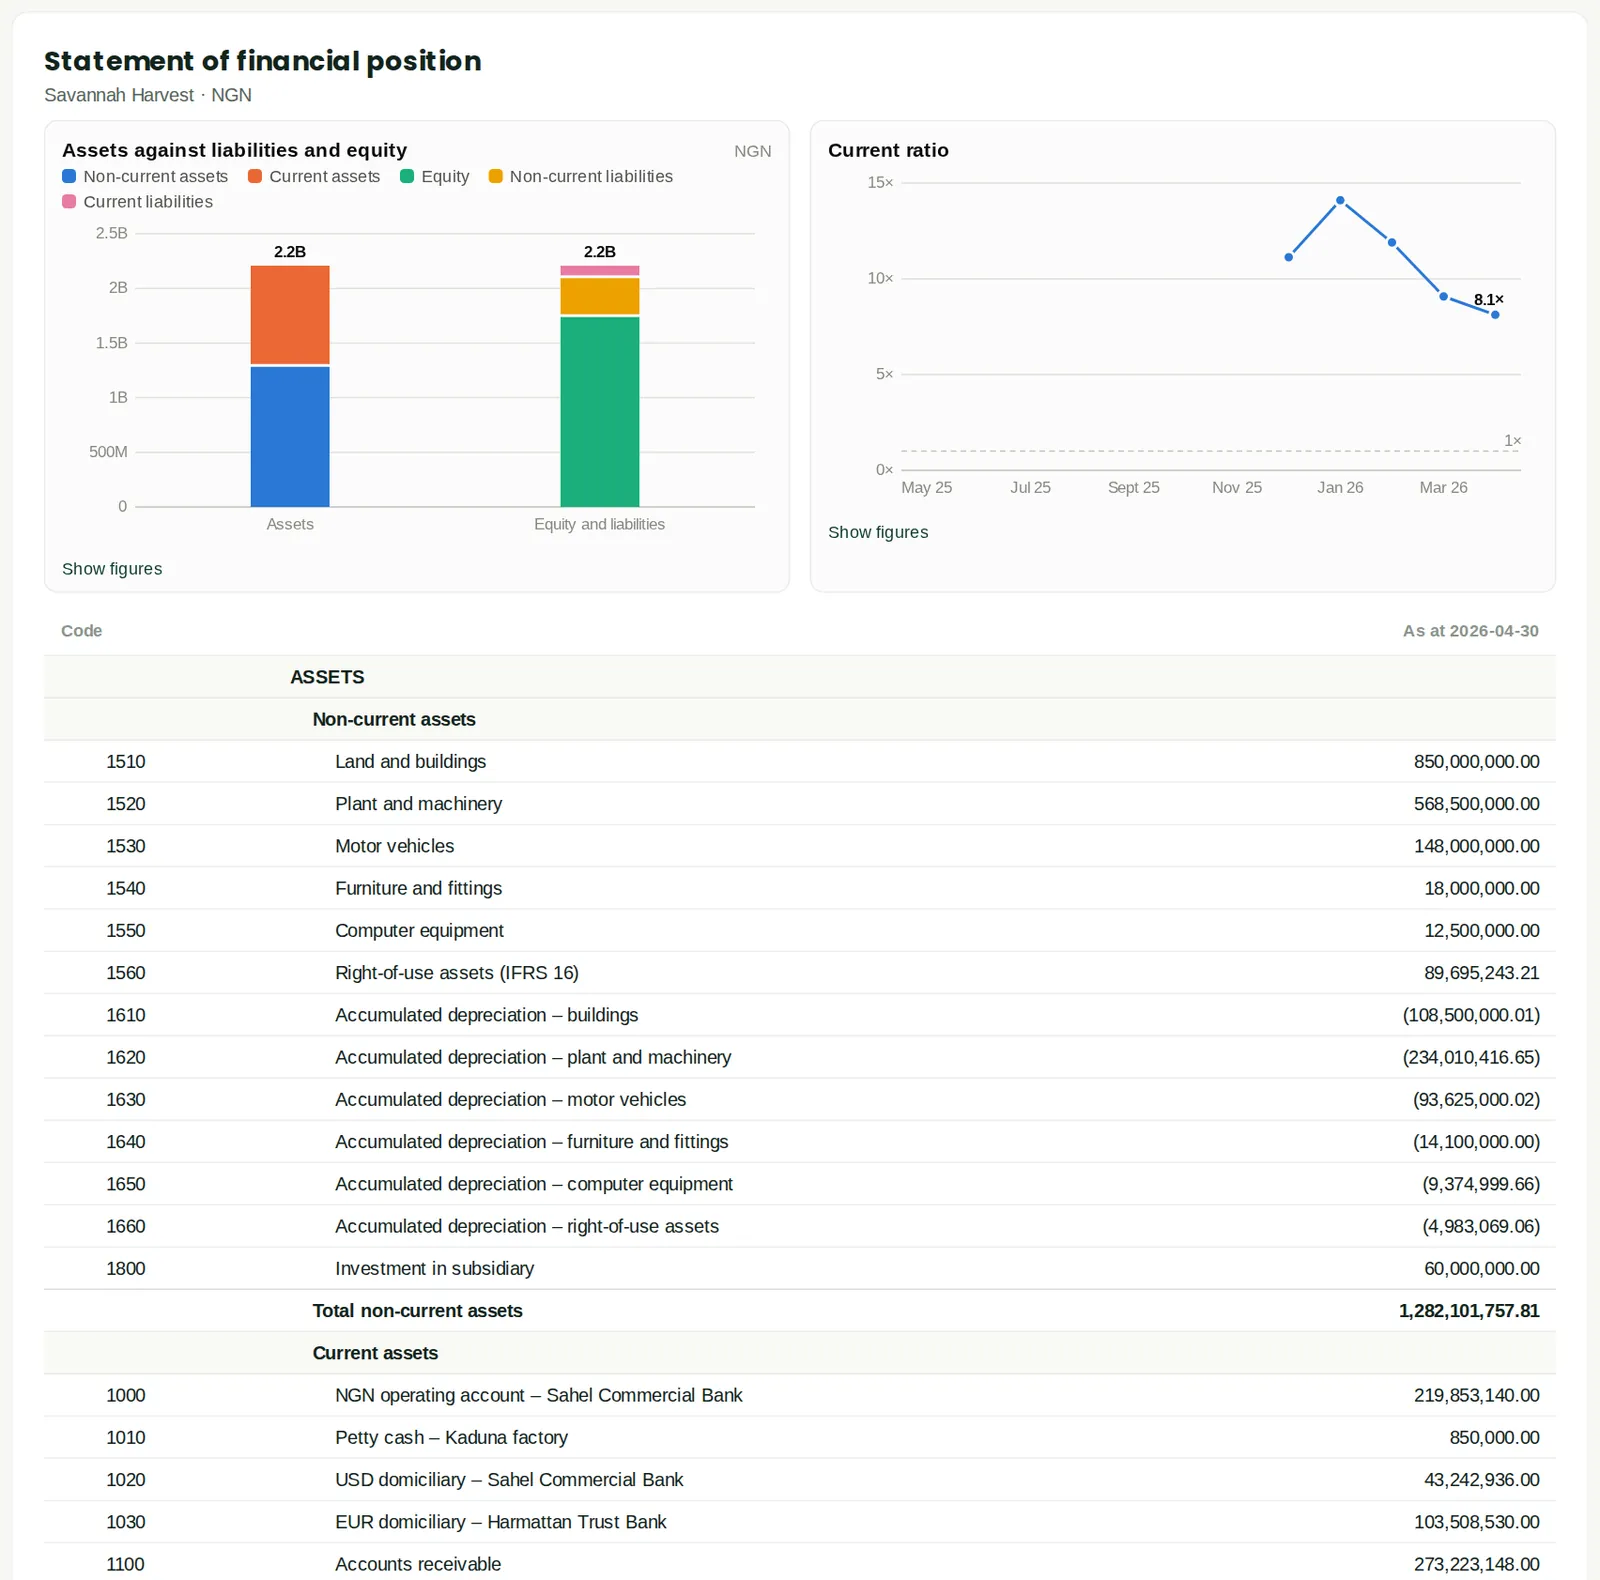
Statement of financial position with current / non-current split and comparison.
19.3 Statement of cash flows
Why
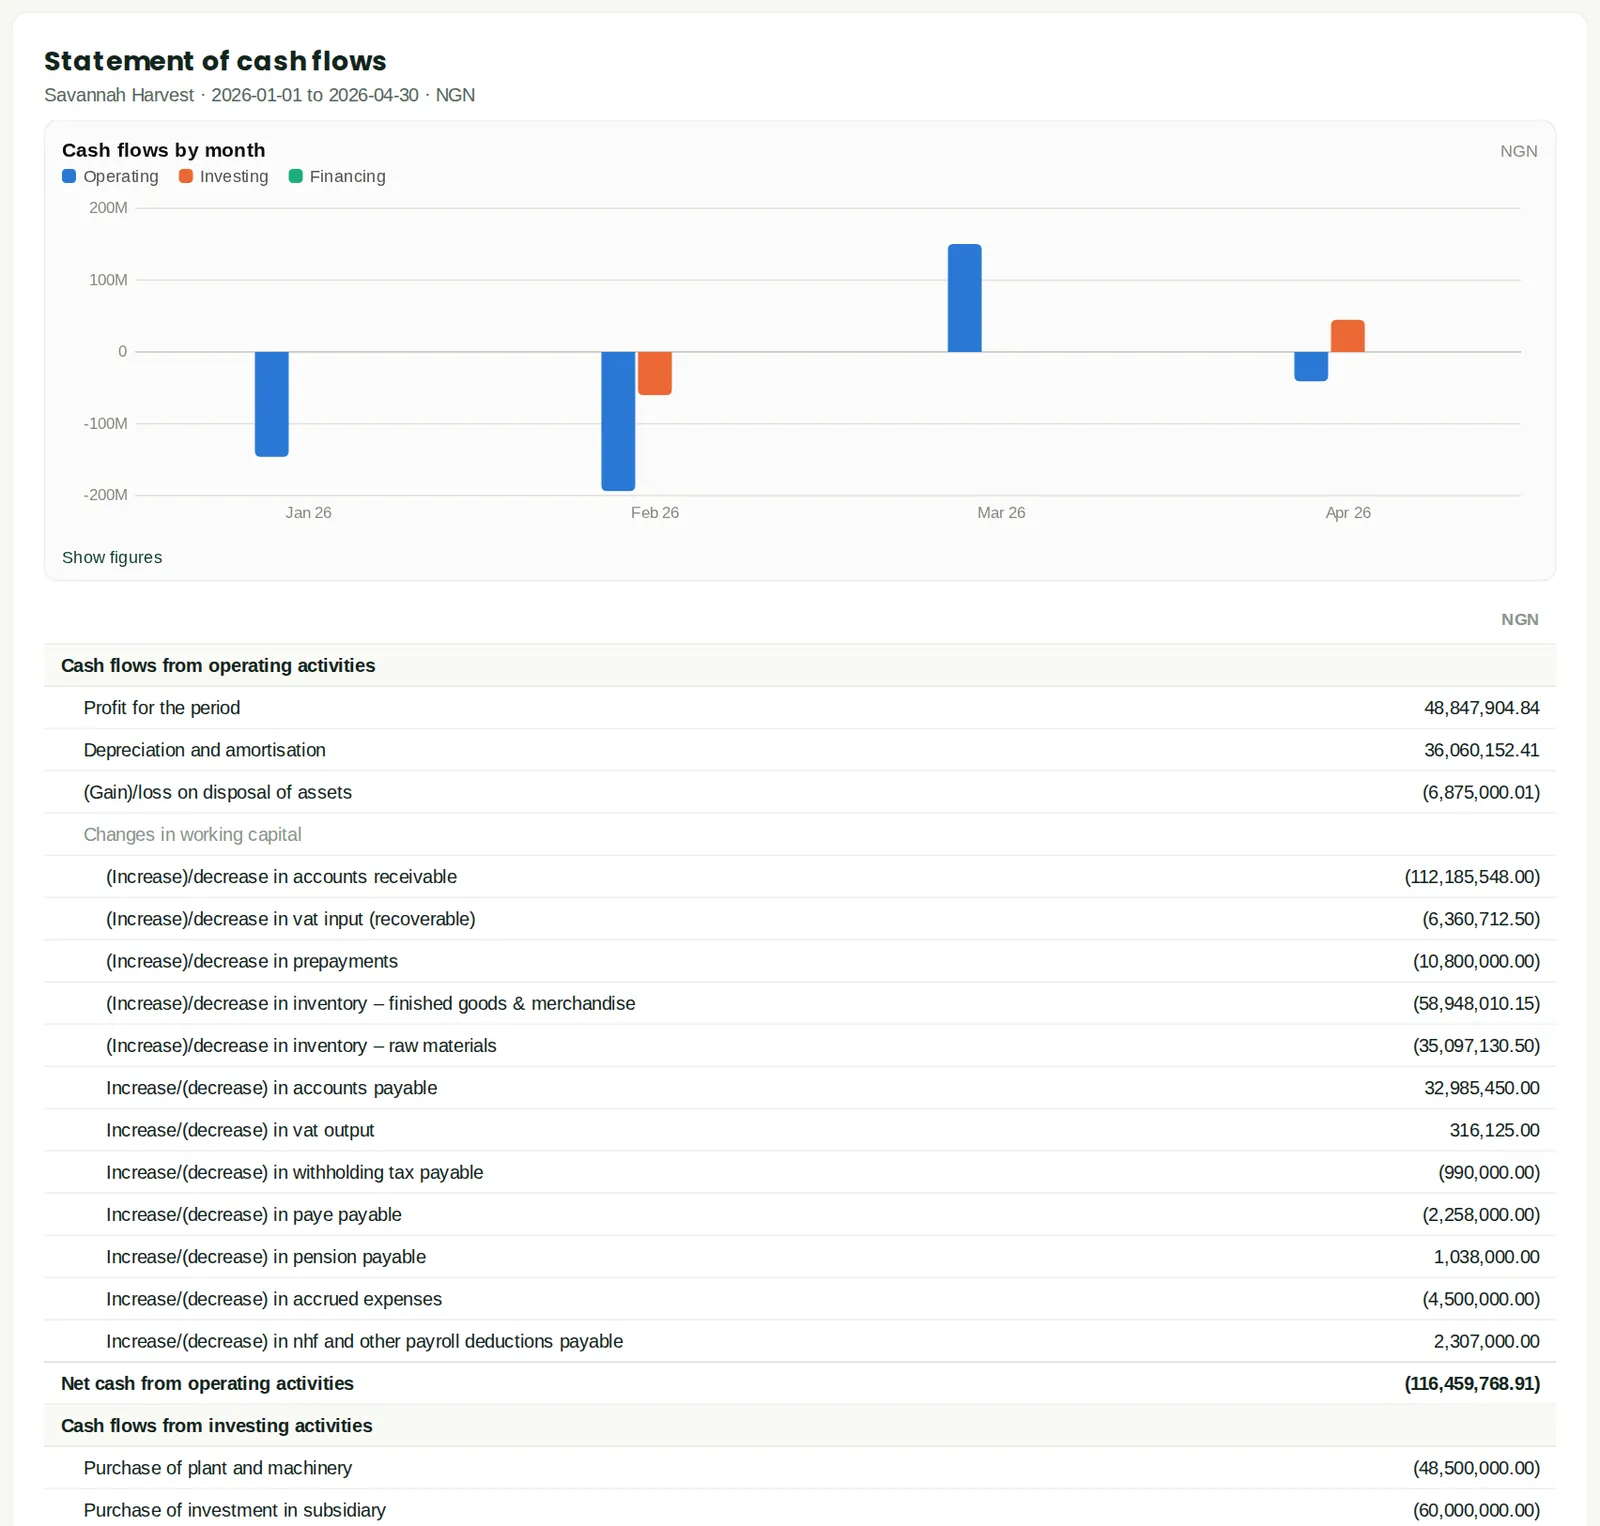
Indirect method (IAS 7; from operating profit under IFRS 18): operating, investing and financing, reconciled to cash.
19.4 Notes to the financial statements
Why
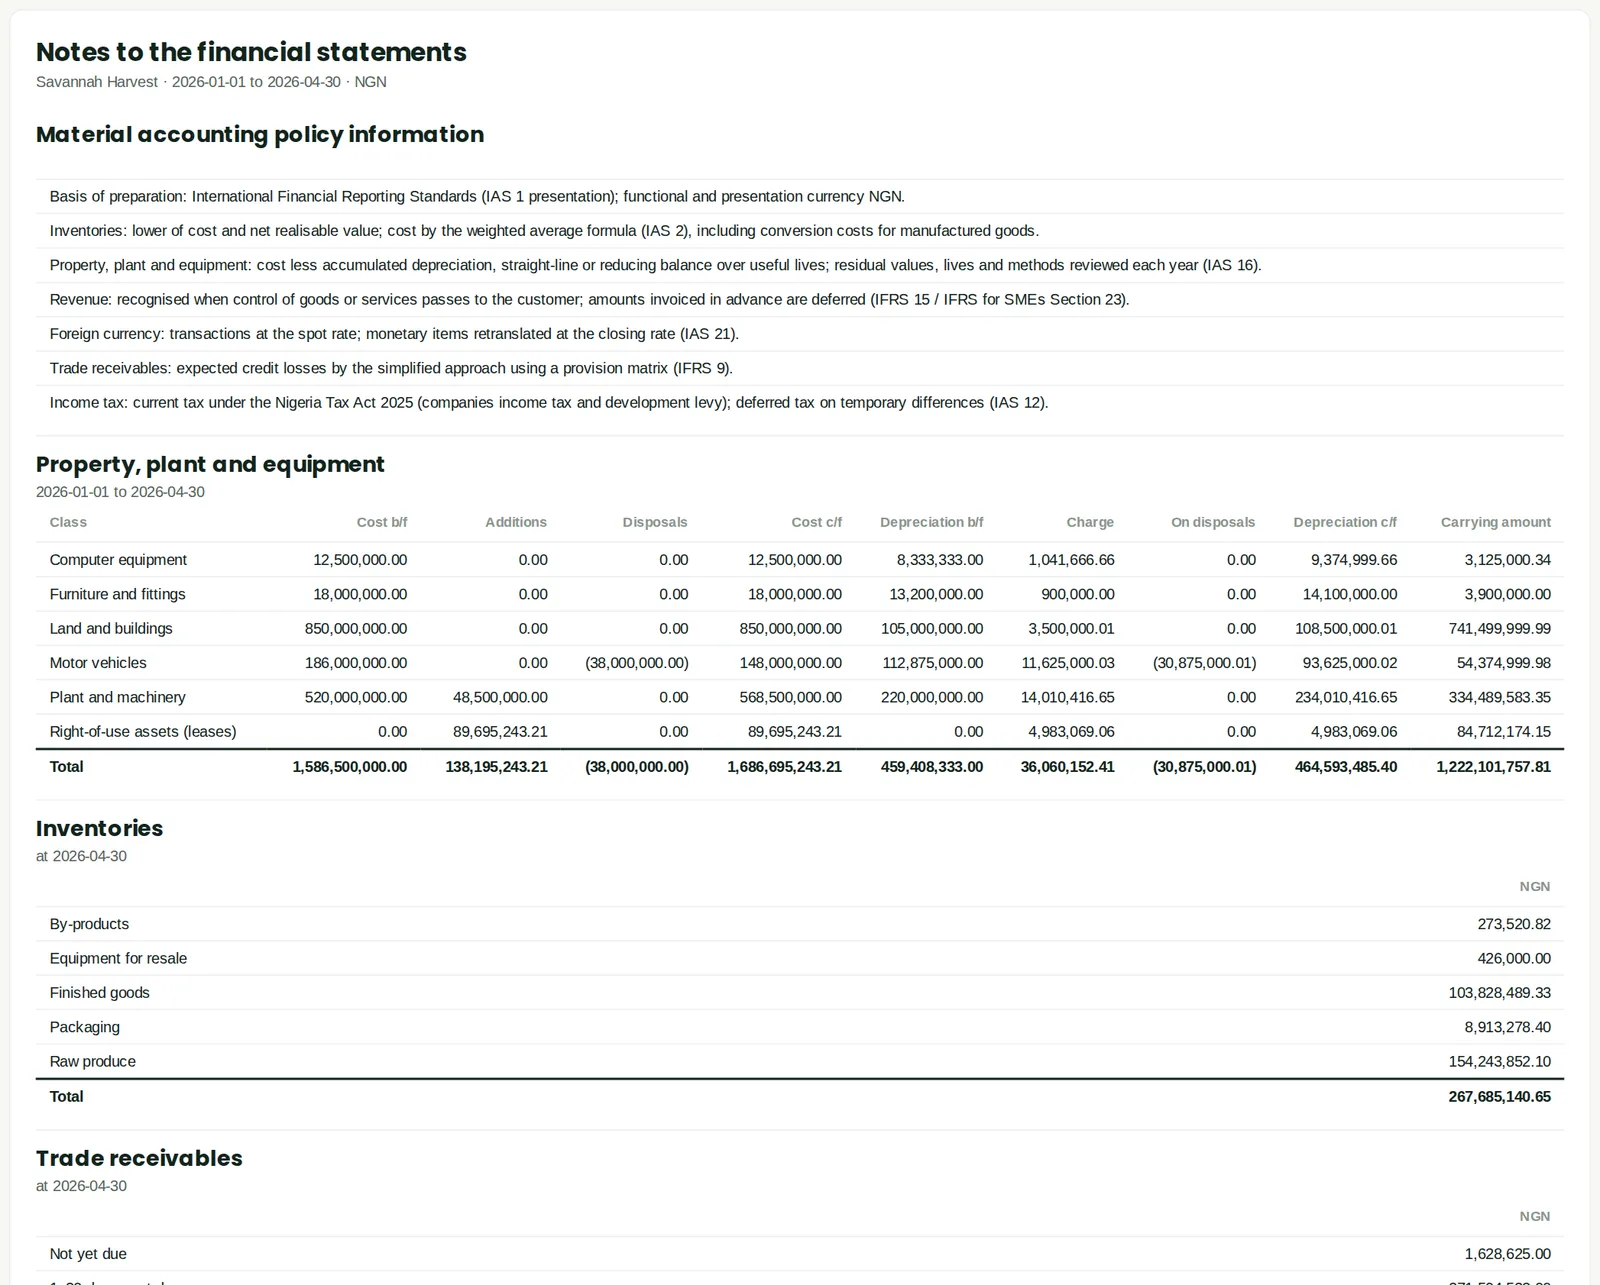
Accounting policies, PPE roll-forward, inventories, receivables and ECL, payables, income tax, expenses by nature, EBITDA (IFRS 18 MPM) and related parties.
19.5 Statement of changes in equity
Why
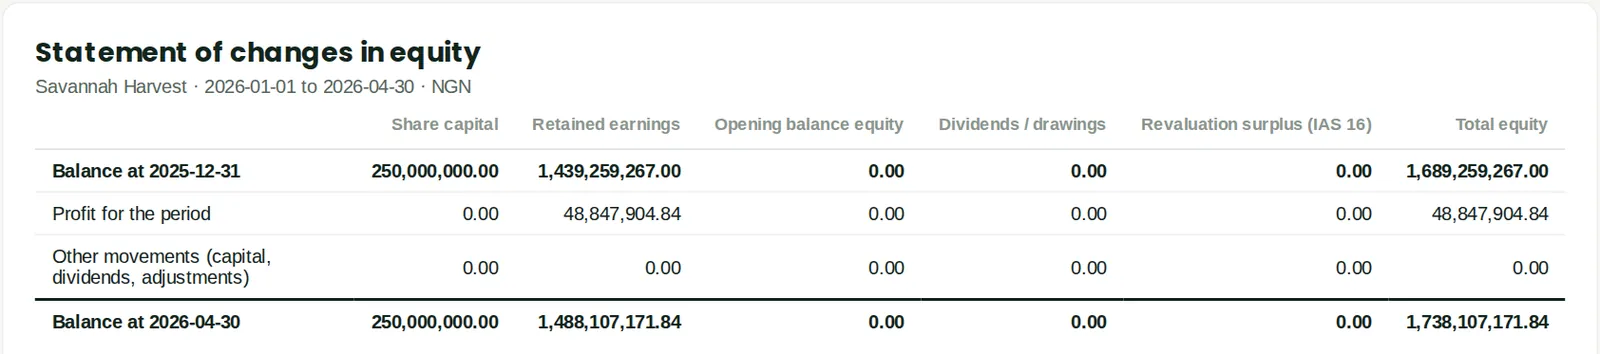
Movements in share capital, reserves and retained earnings.
19.6 Management pack (super report)
Why
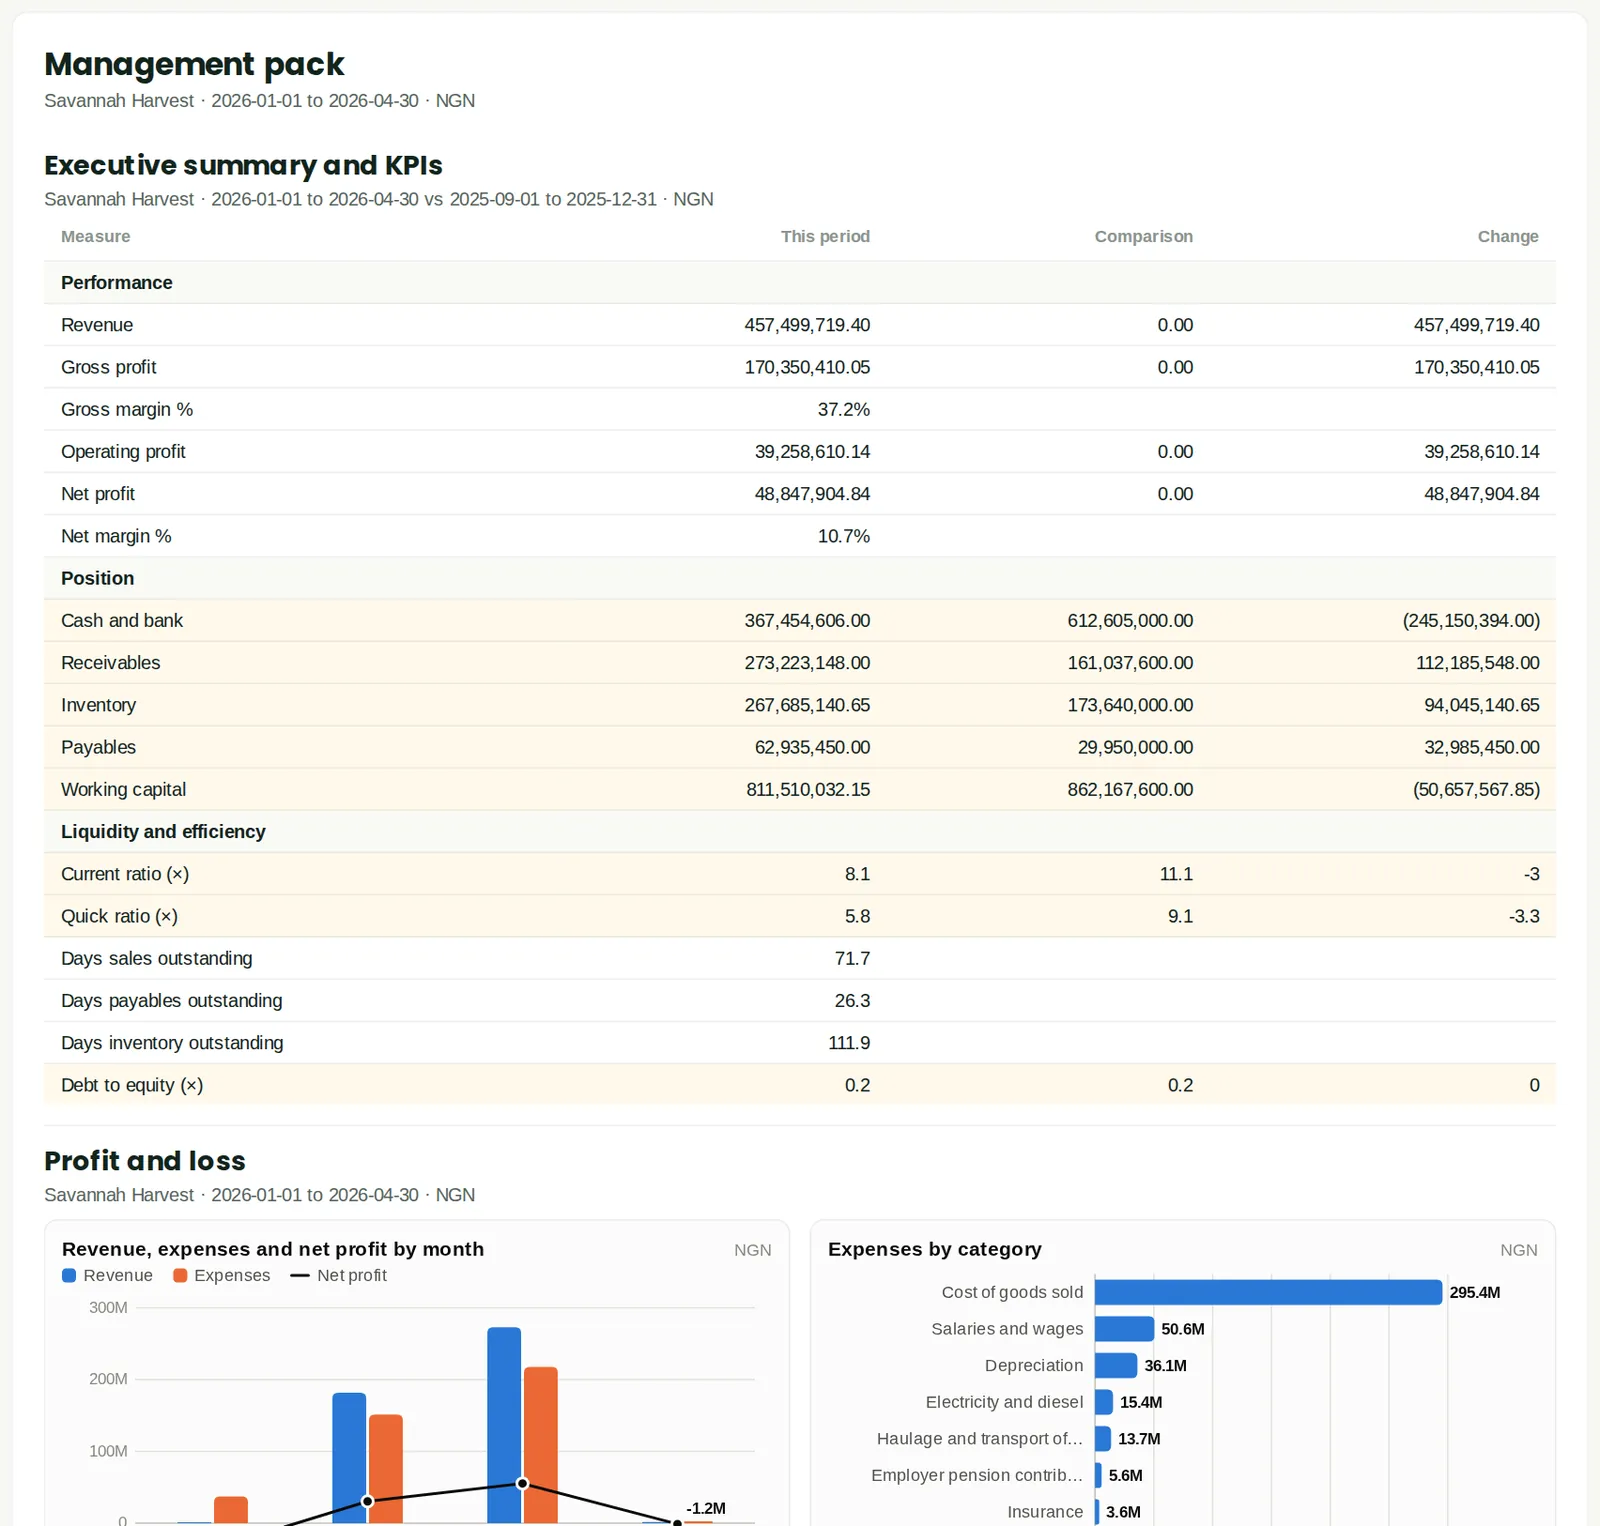
Board pack in one run: KPIs, P&L vs prior period, balance sheet, cash flow, receivables, payables, top customers and items, stock and budget variance.
19.7 Executive summary and KPIs
Why
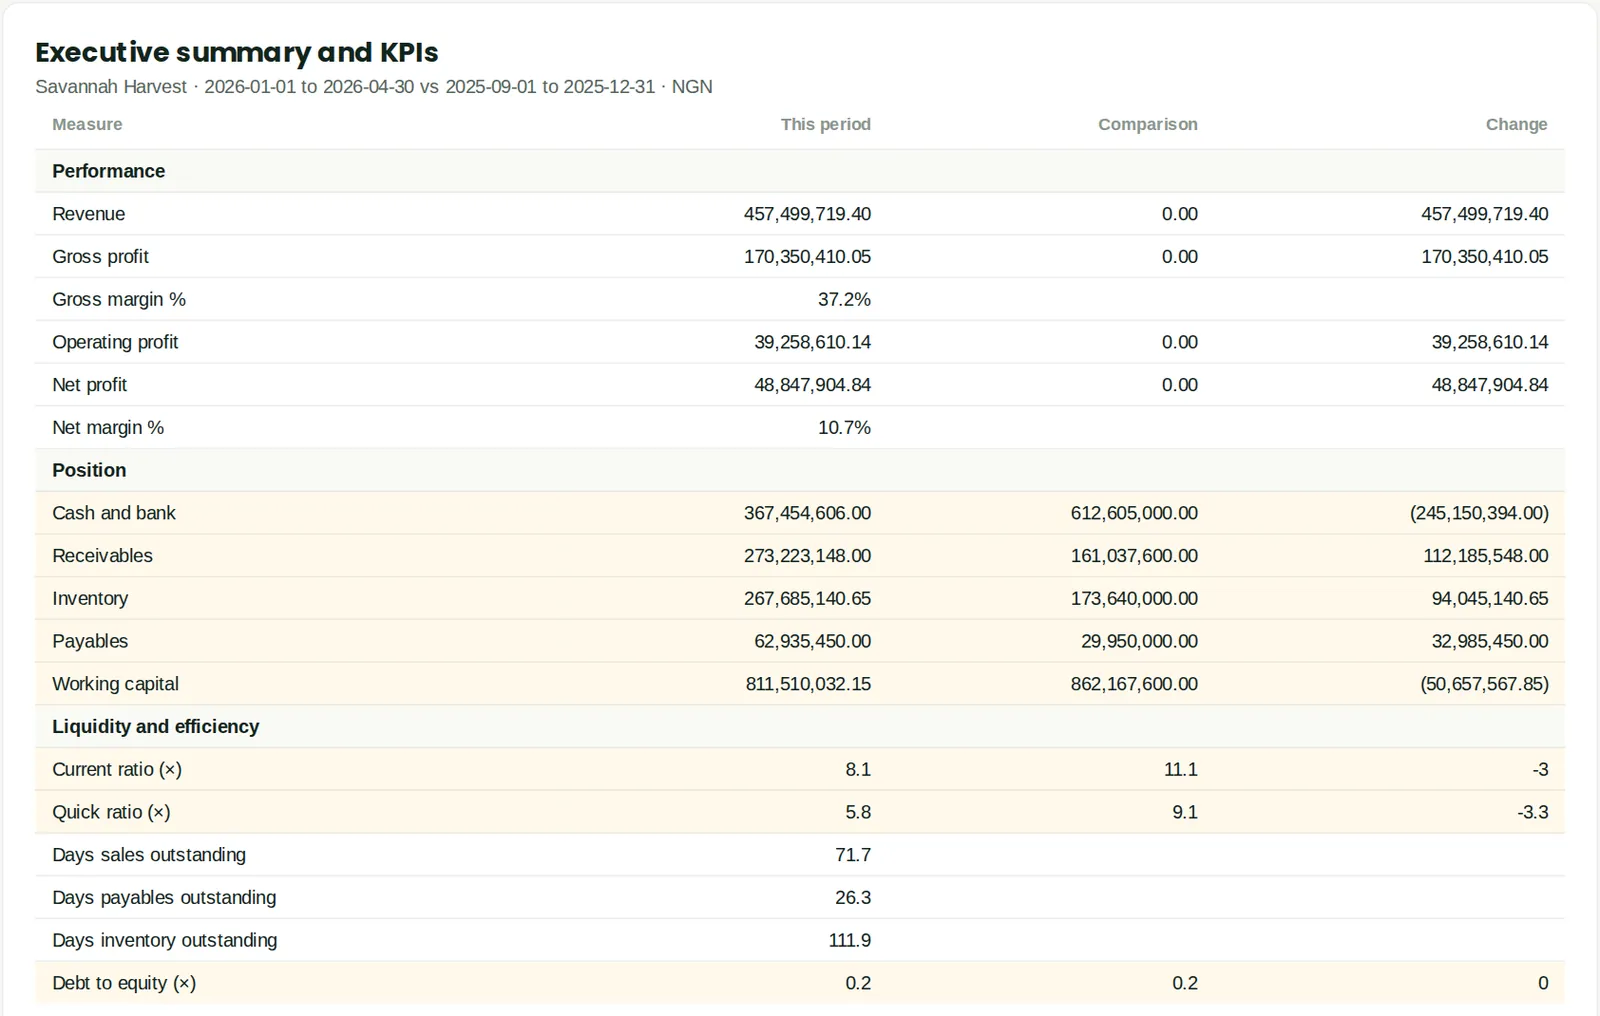
Revenue, margins, working capital, liquidity and efficiency ratios, cash runway.
19.8 Budget vs actual
Why
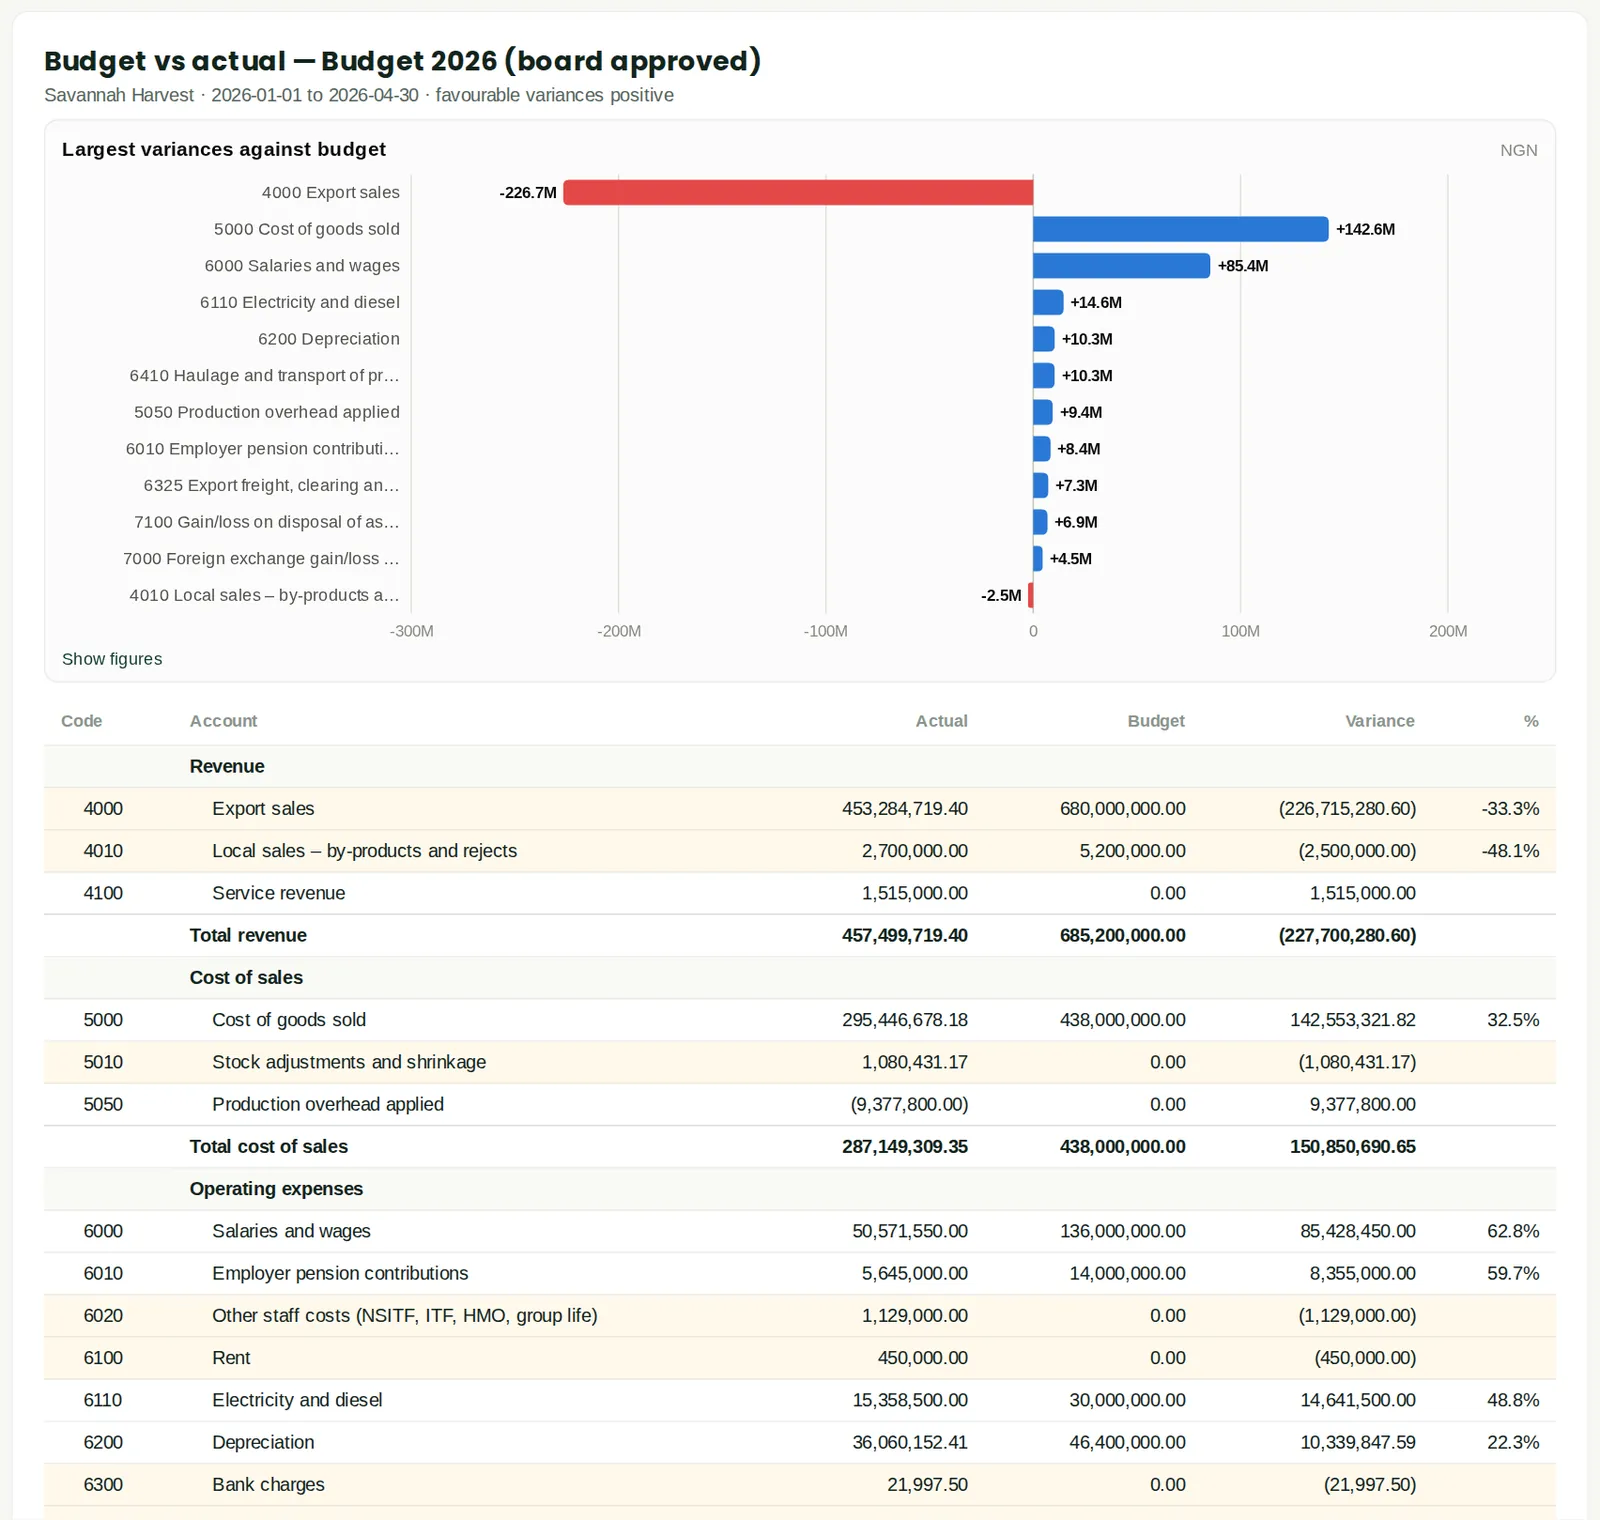
Variance by account against a budget.
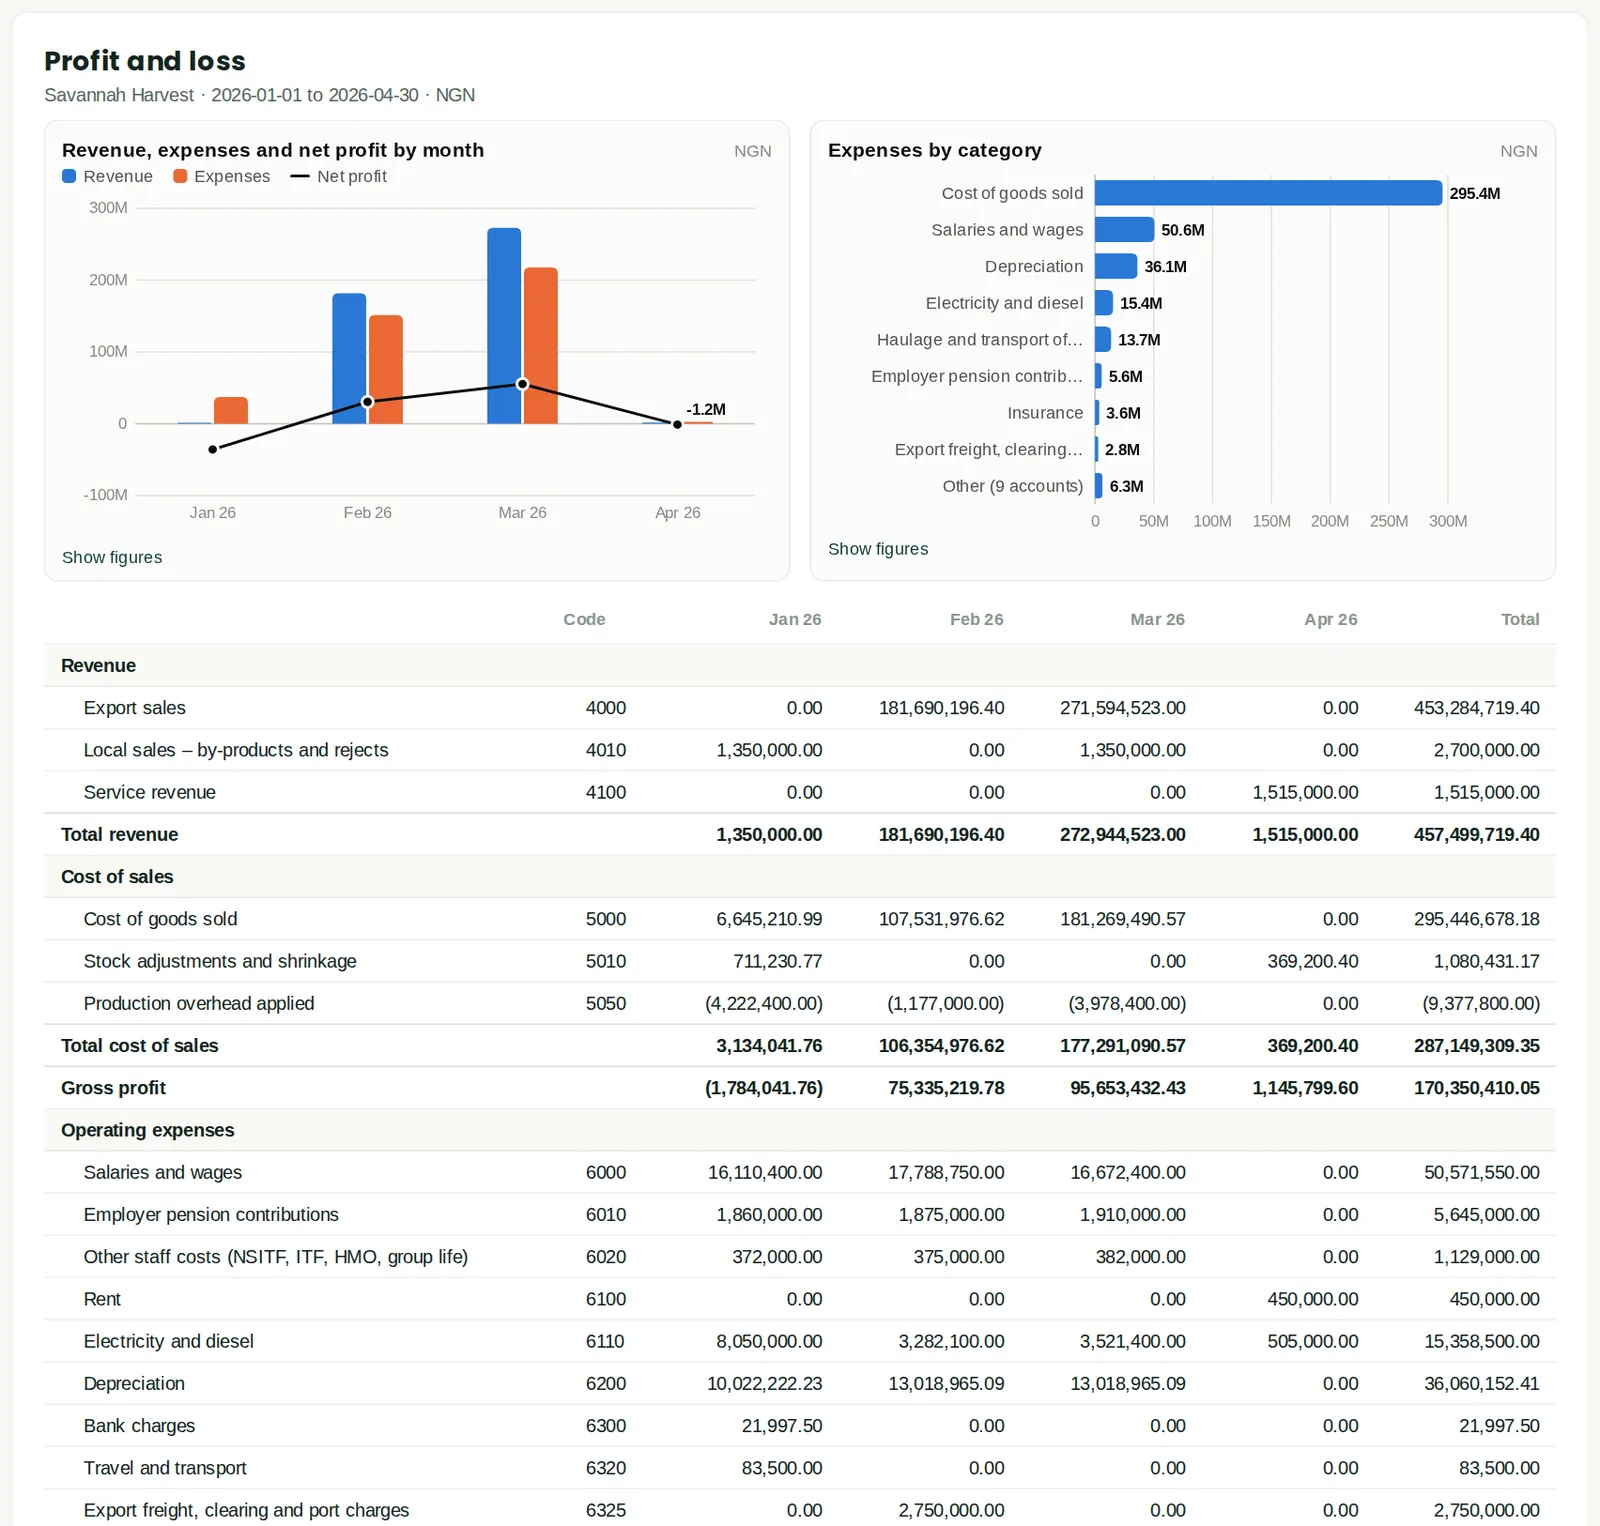
19.9 Profit and loss by month
Why
Twelve-column trend.
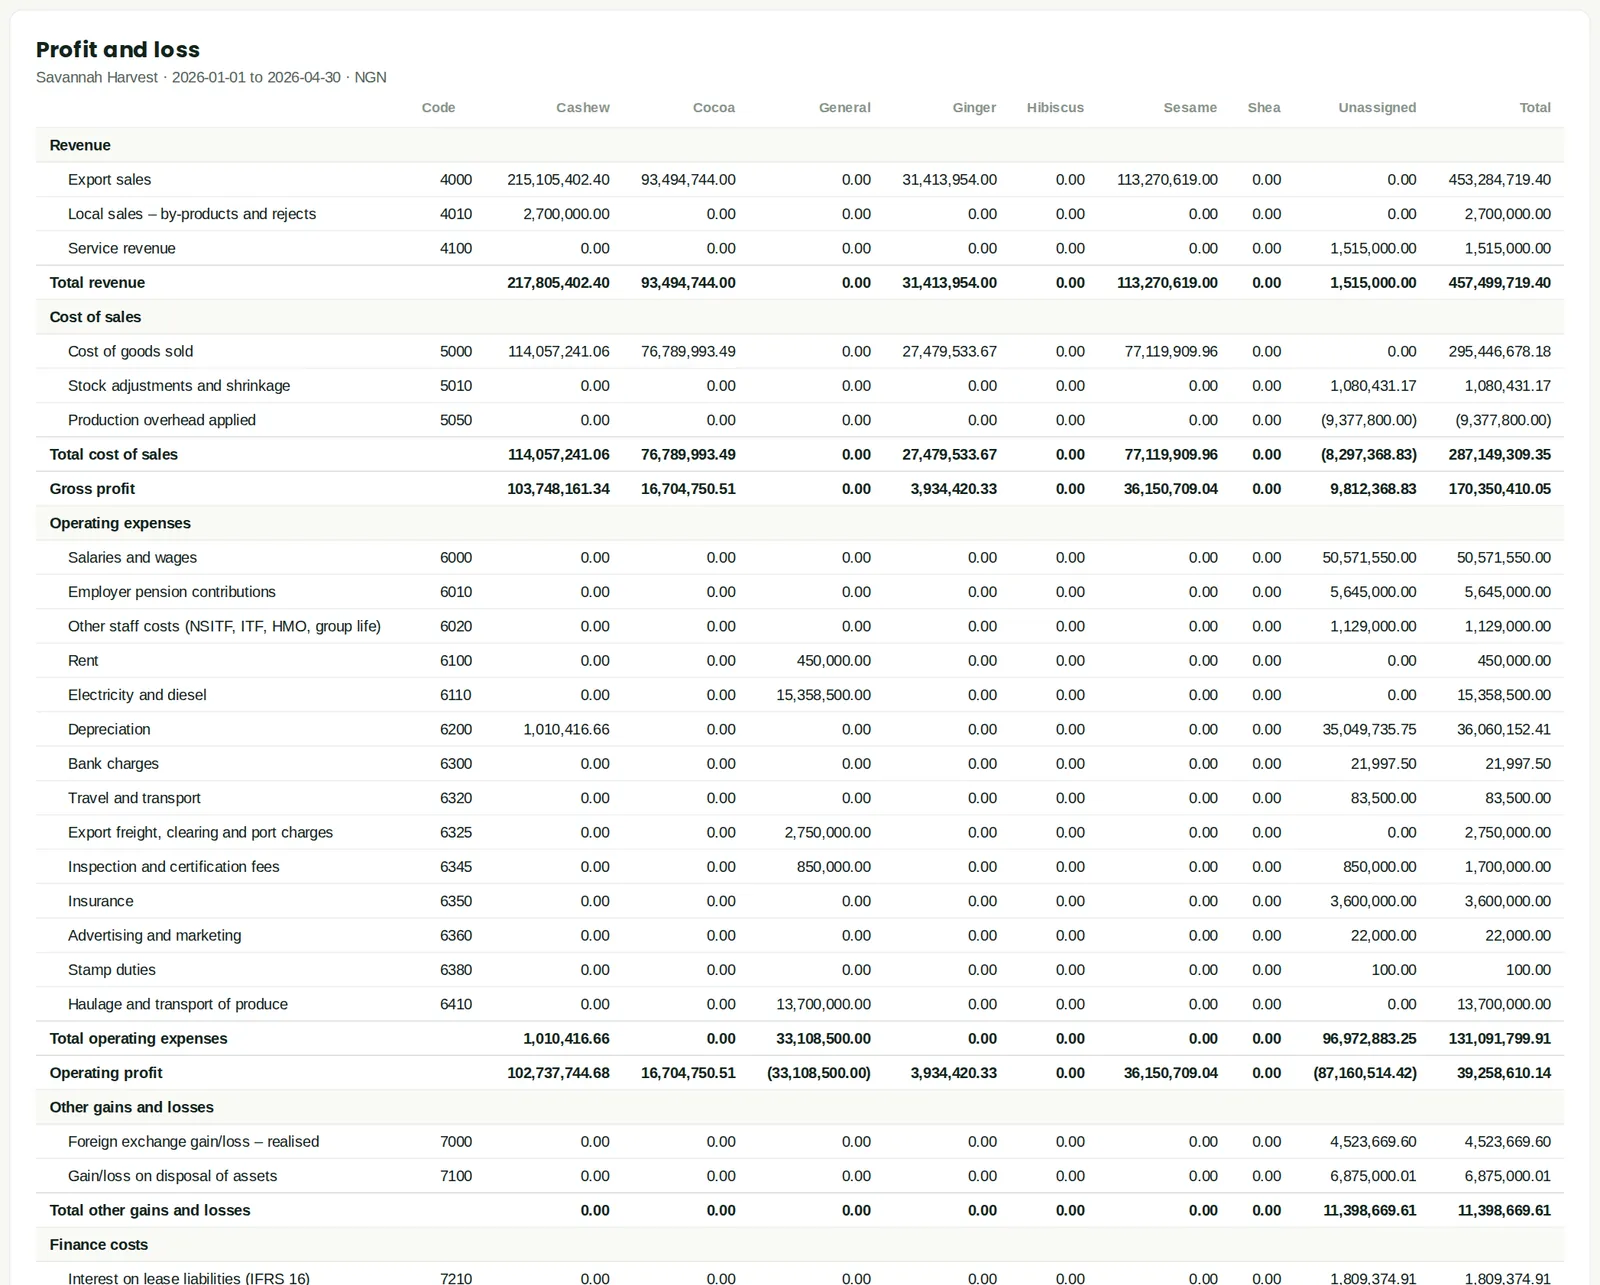
19.10 Profit and loss by tracking category
Why
Departments, branches, projects — one column each.
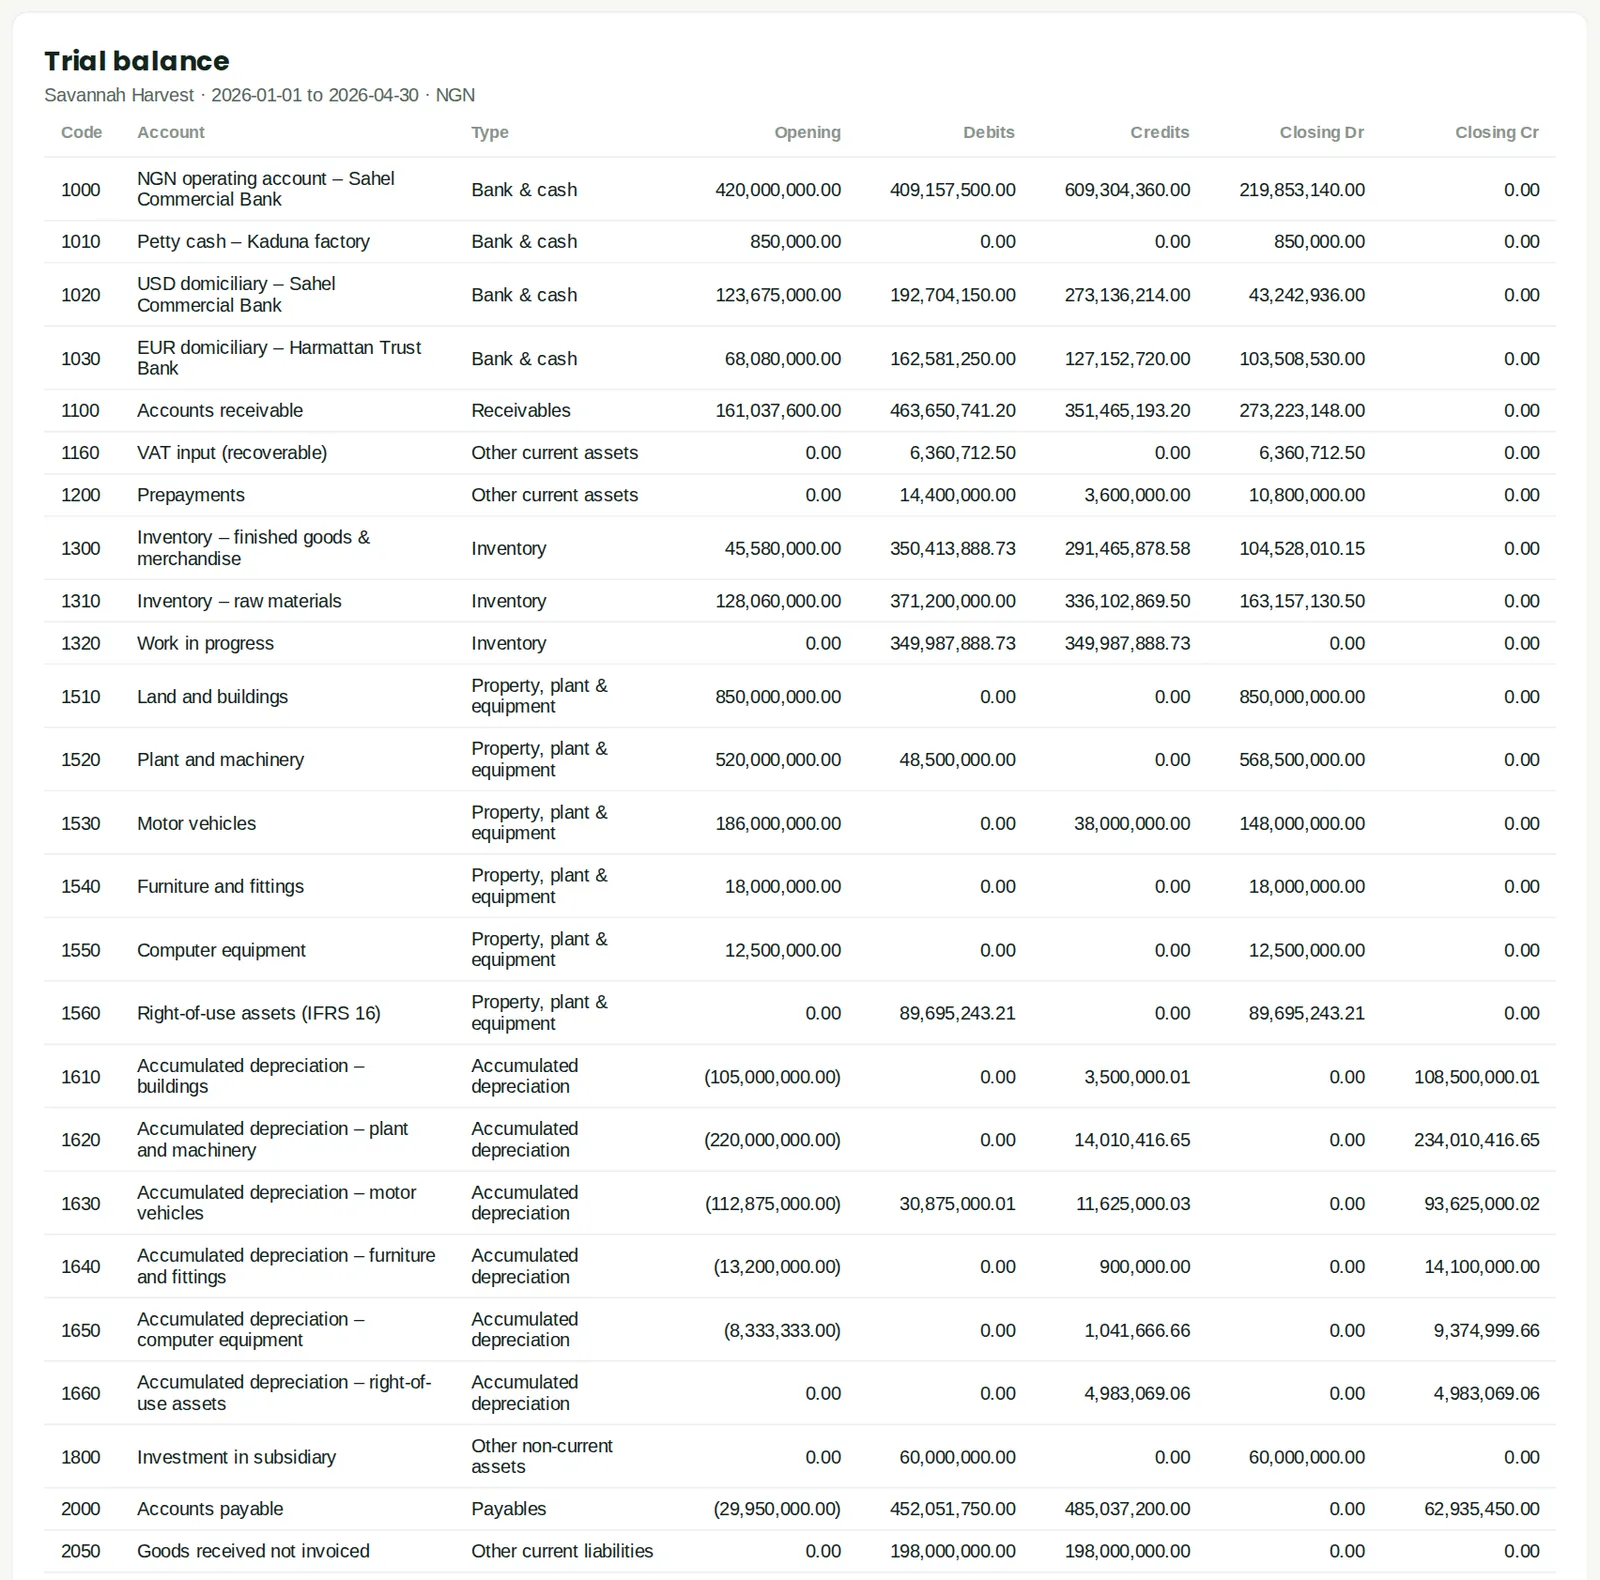
19.11 Trial balance
Why
Debit and credit balances of every account.
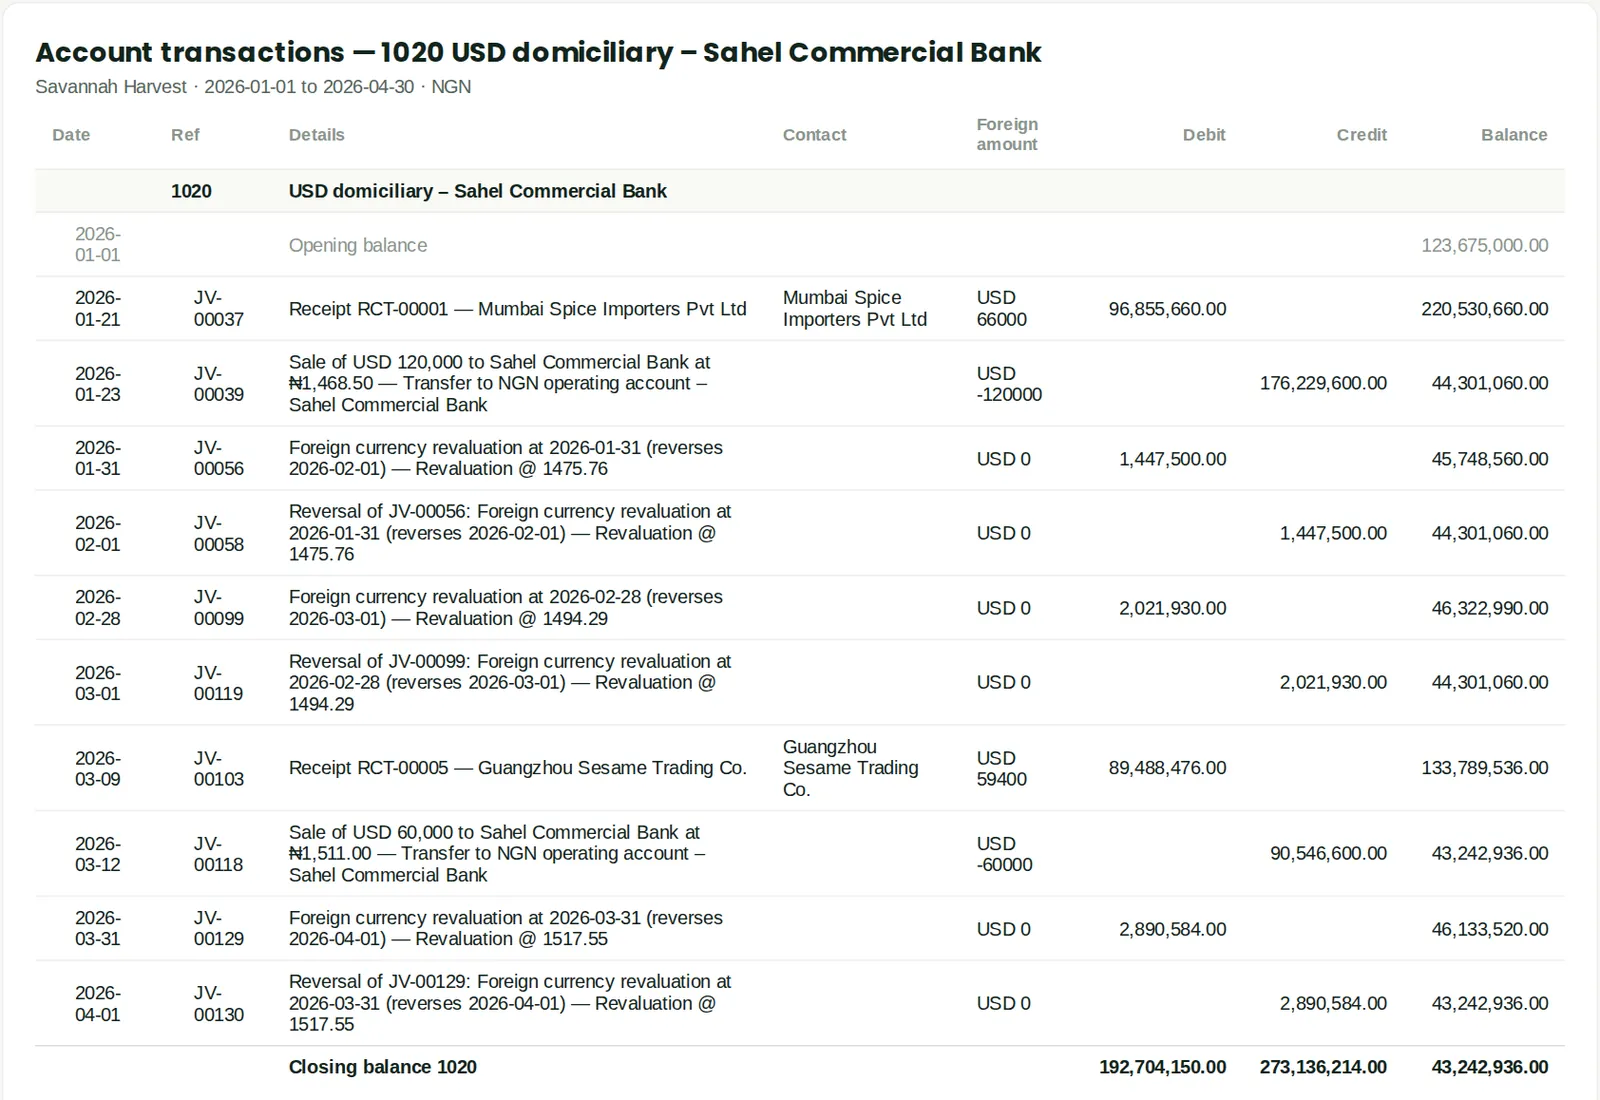
19.12 General ledger
Why
Every posted line by account with running balance.
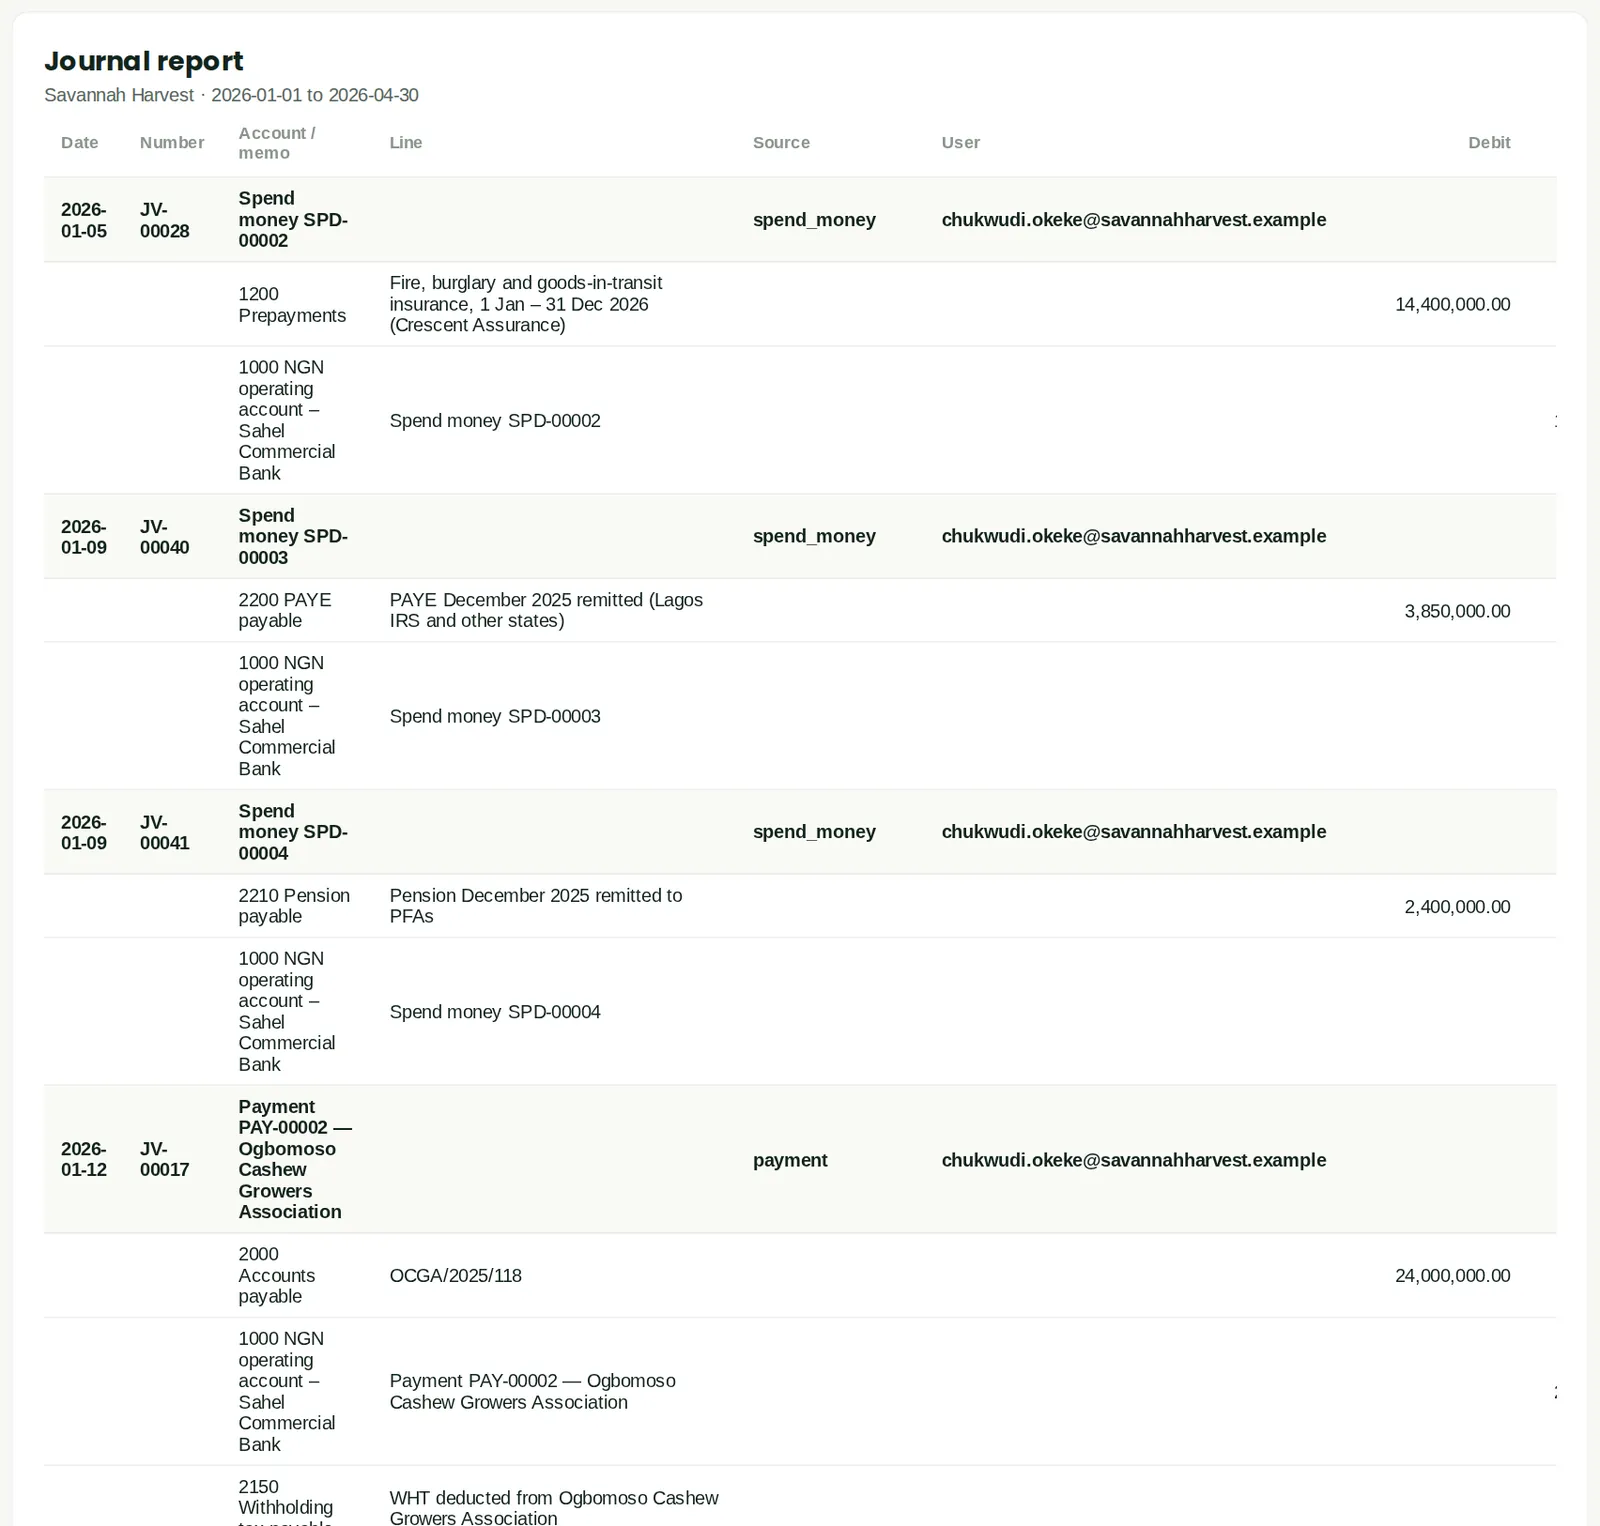
19.13 Journal report
Why
Posted journals with their lines, by source.
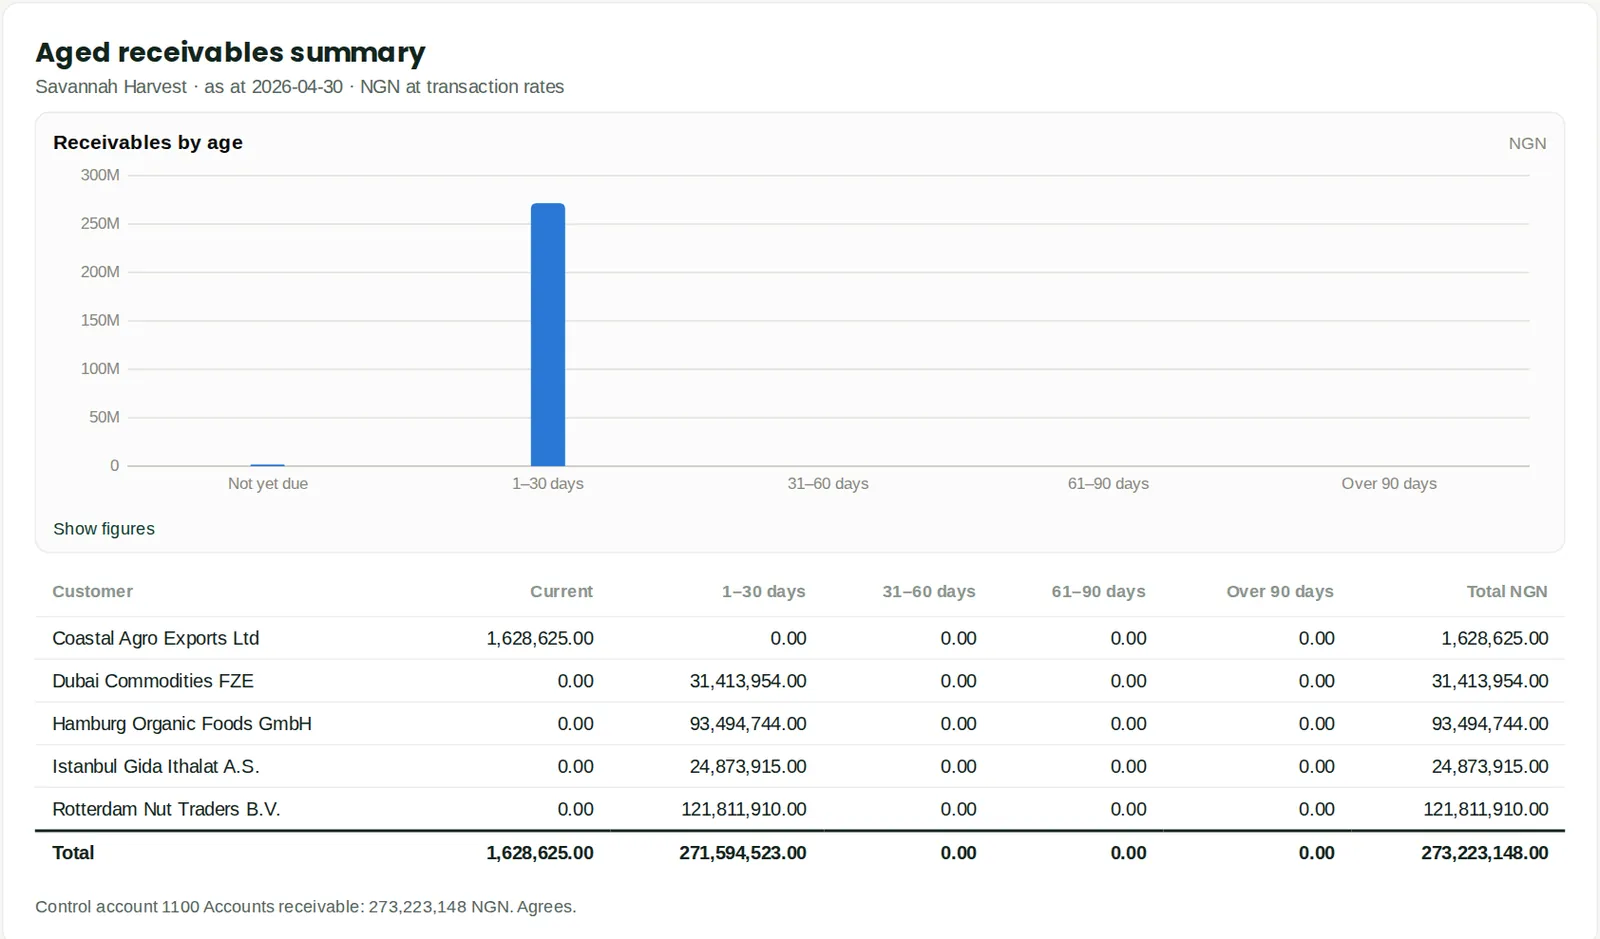
19.14 Aged receivables summary
Why
Customer balances by age, reconciled to the control account.
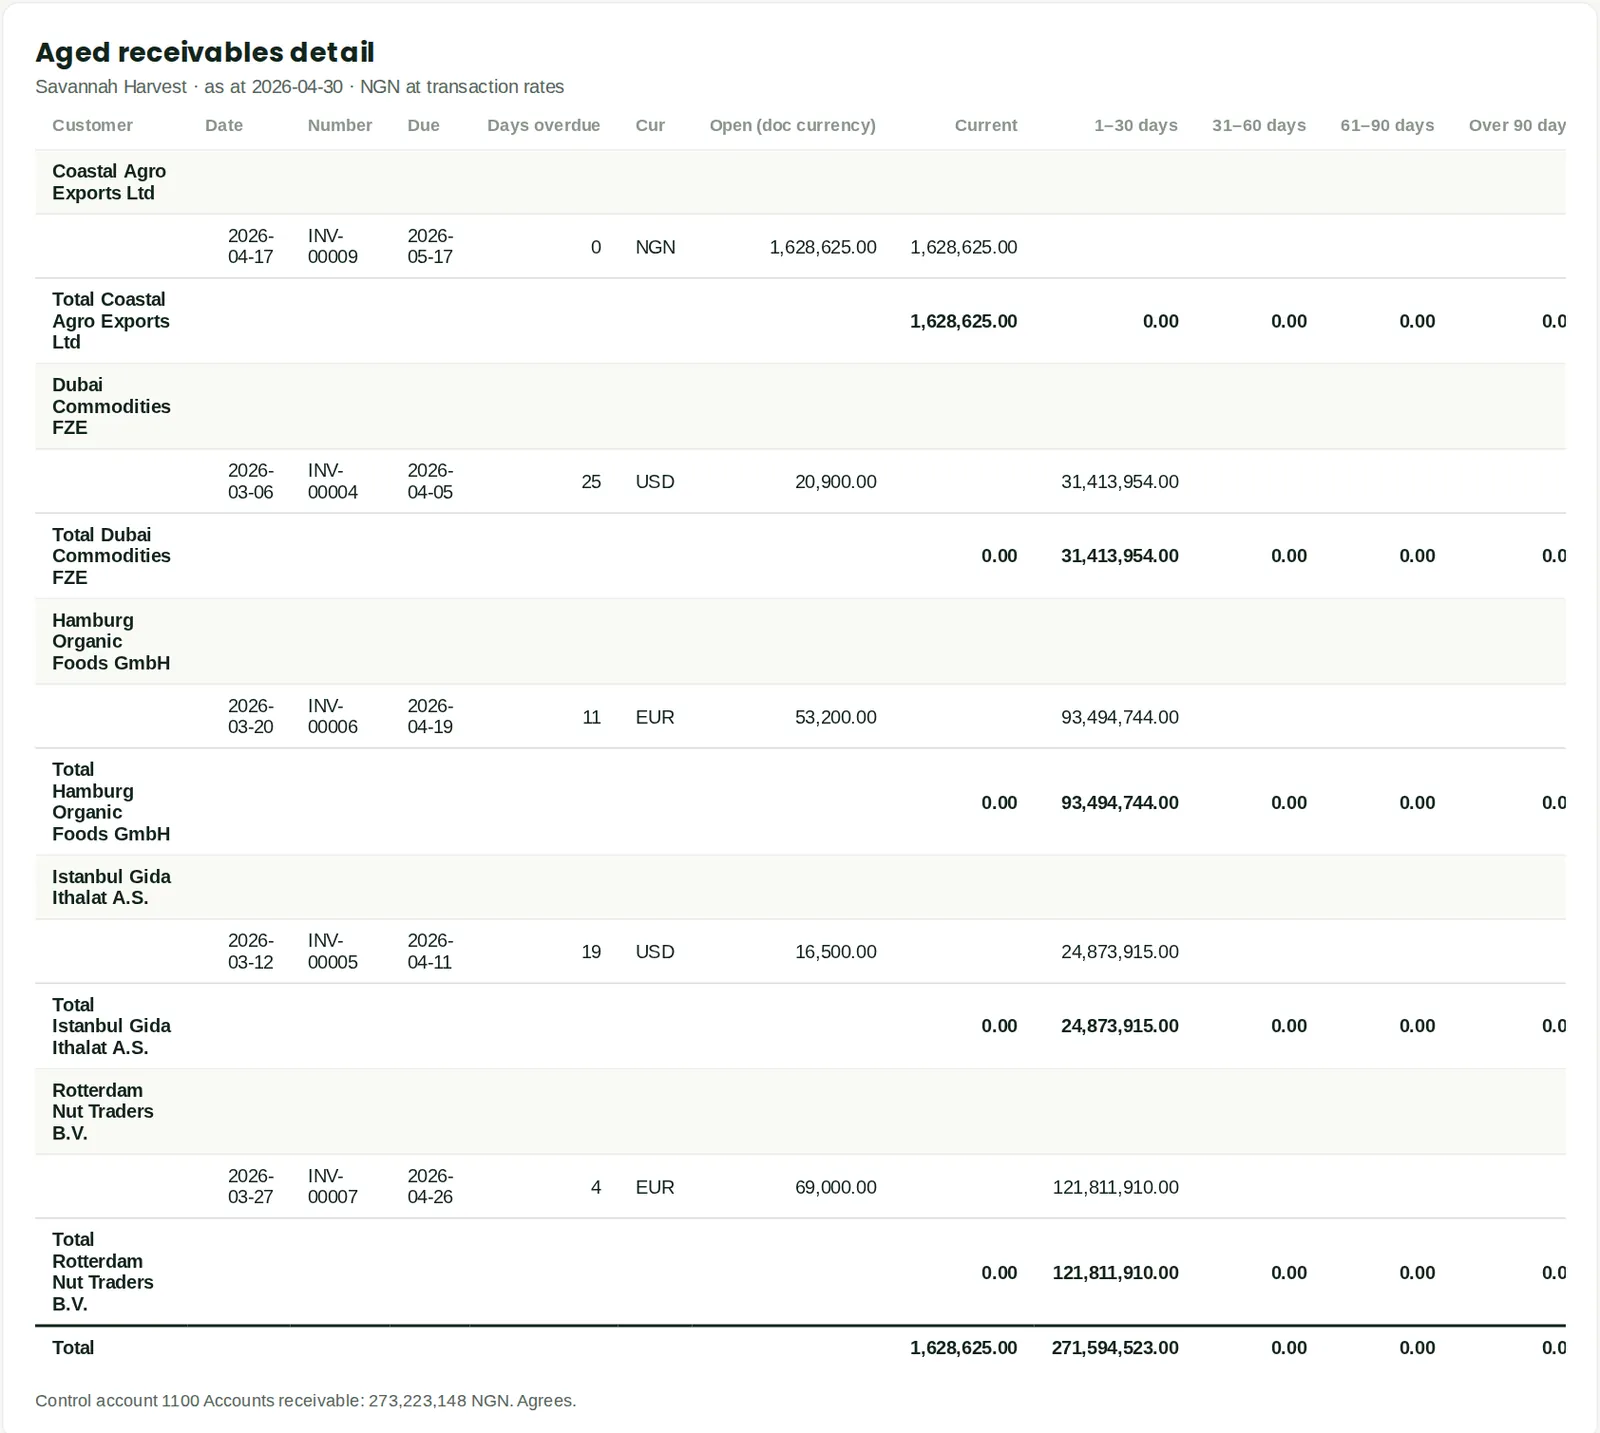
19.15 Aged receivables detail
Why
Every open invoice and credit.
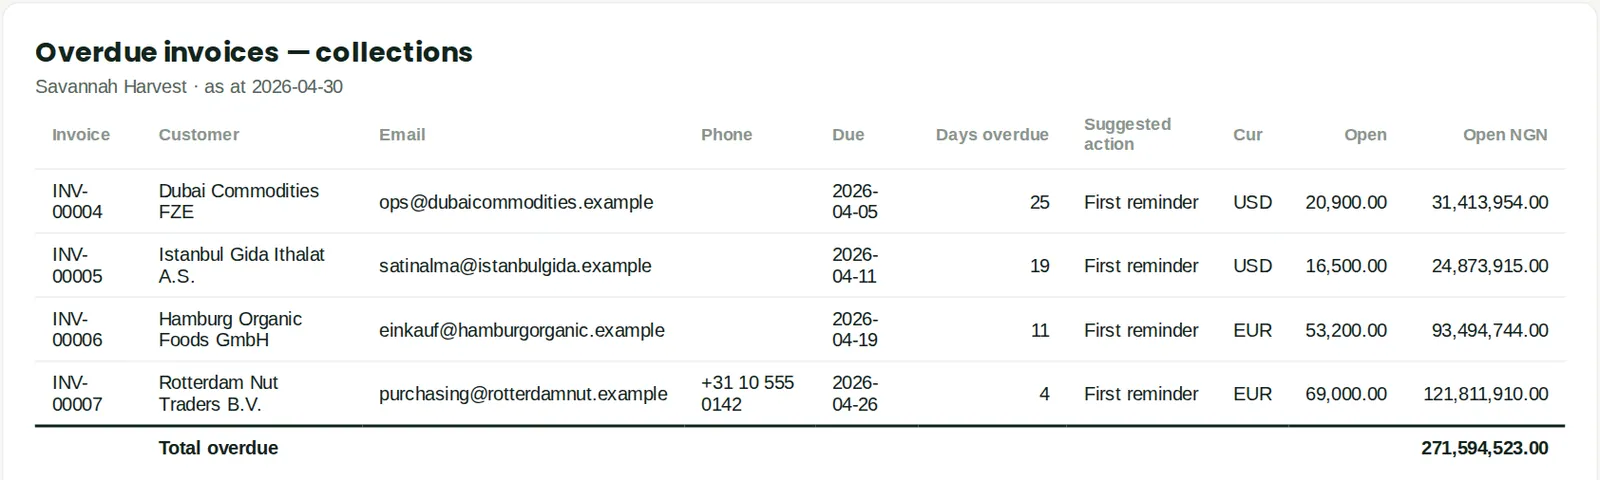
19.16 Overdue invoices — collections
Why
Overdue invoices with suggested dunning stage and contact details.
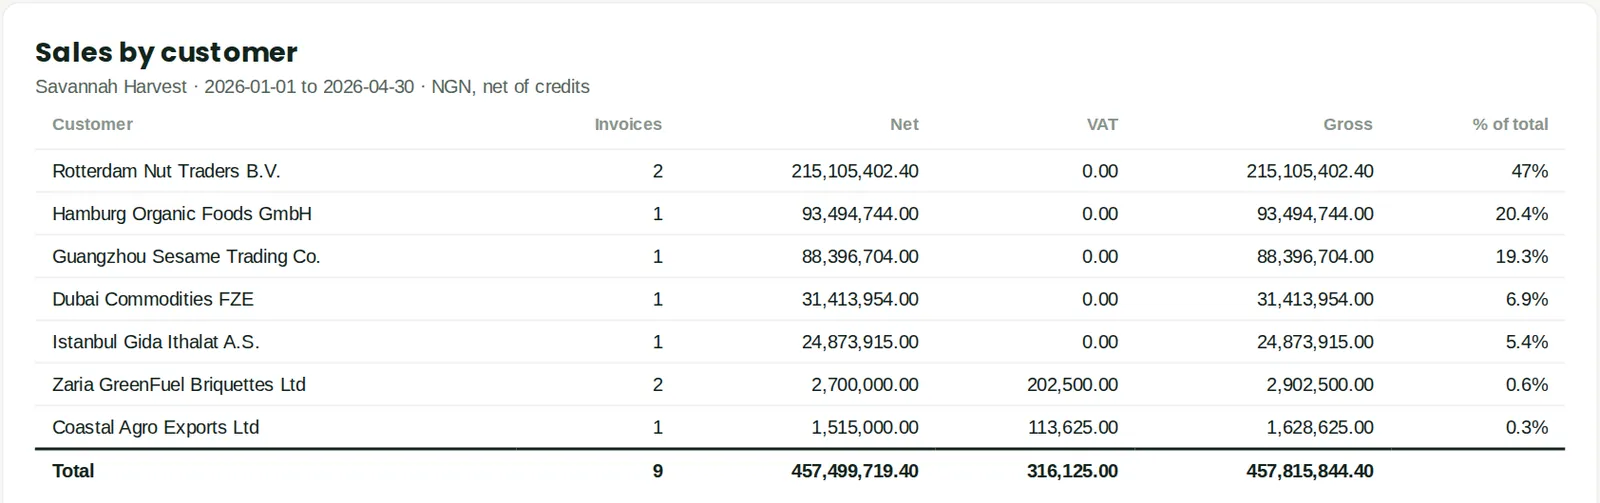
19.17 Sales by customer
Why
Net sales per customer.
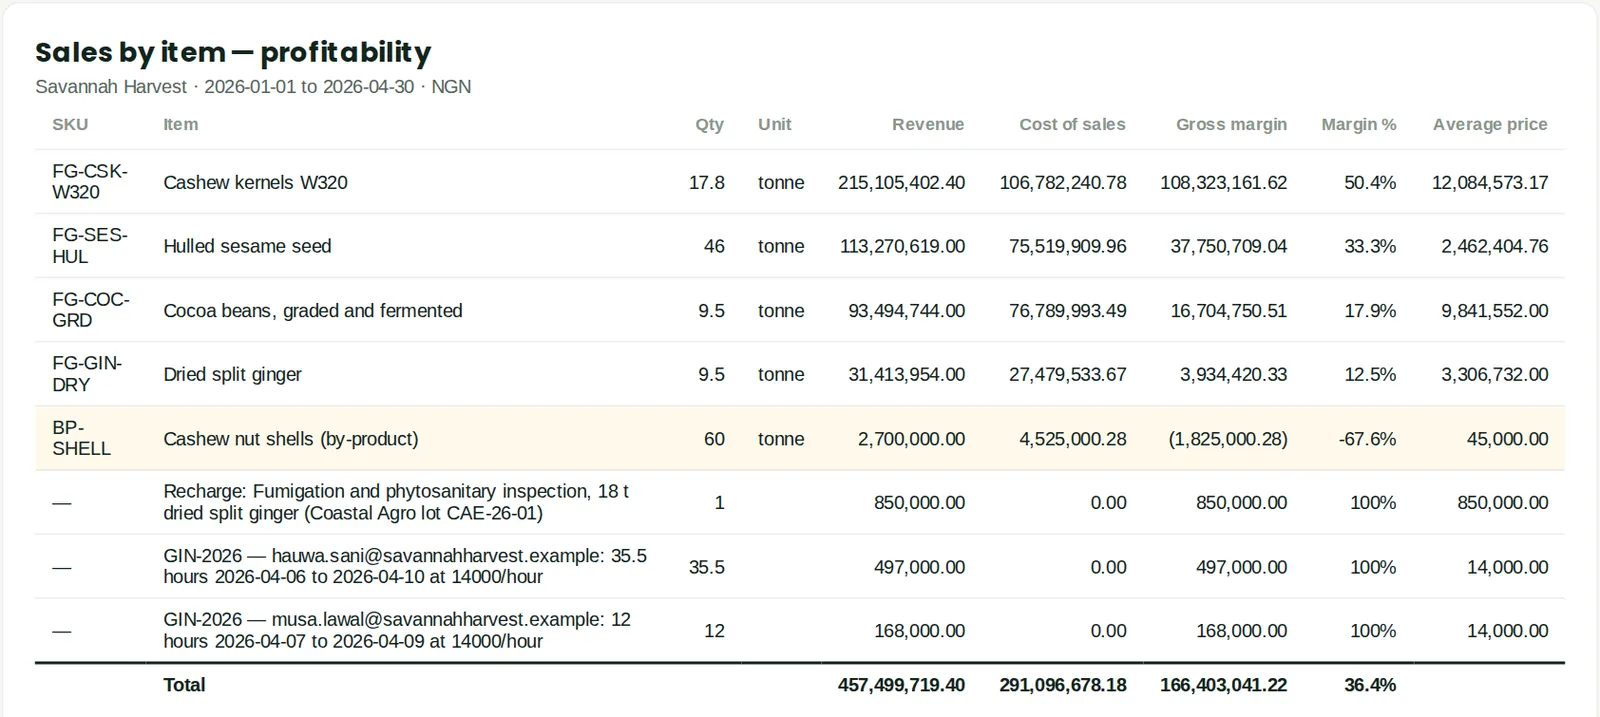
19.18 Sales by item — profitability
Why
Quantity, revenue, cost and gross margin per item.
19.19 Open sales orders

Why
Ordered but not yet invoiced.
19.20 Open quotes

Why
Quotes not yet accepted or converted. Empty: the only quote (QU-00001) had expired.
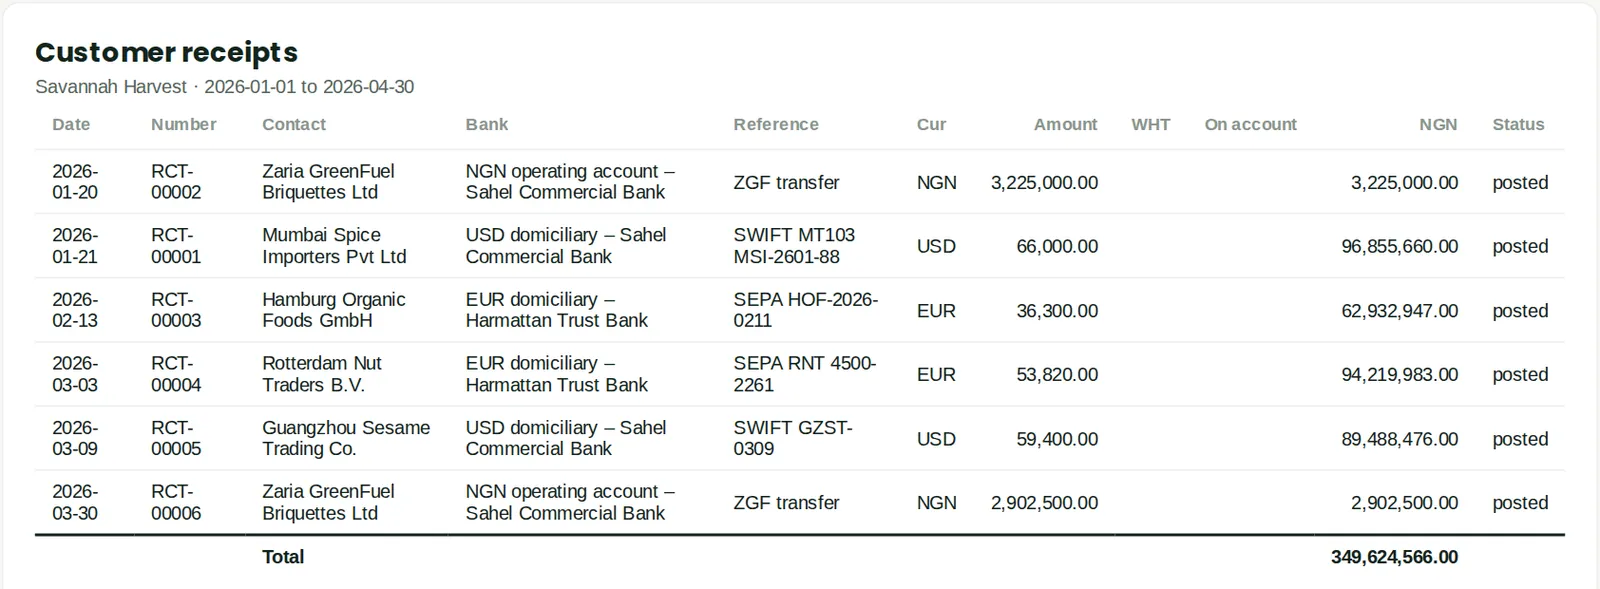
19.21 Customer receipts
Why
Money received, WHT suffered and unallocated amounts.
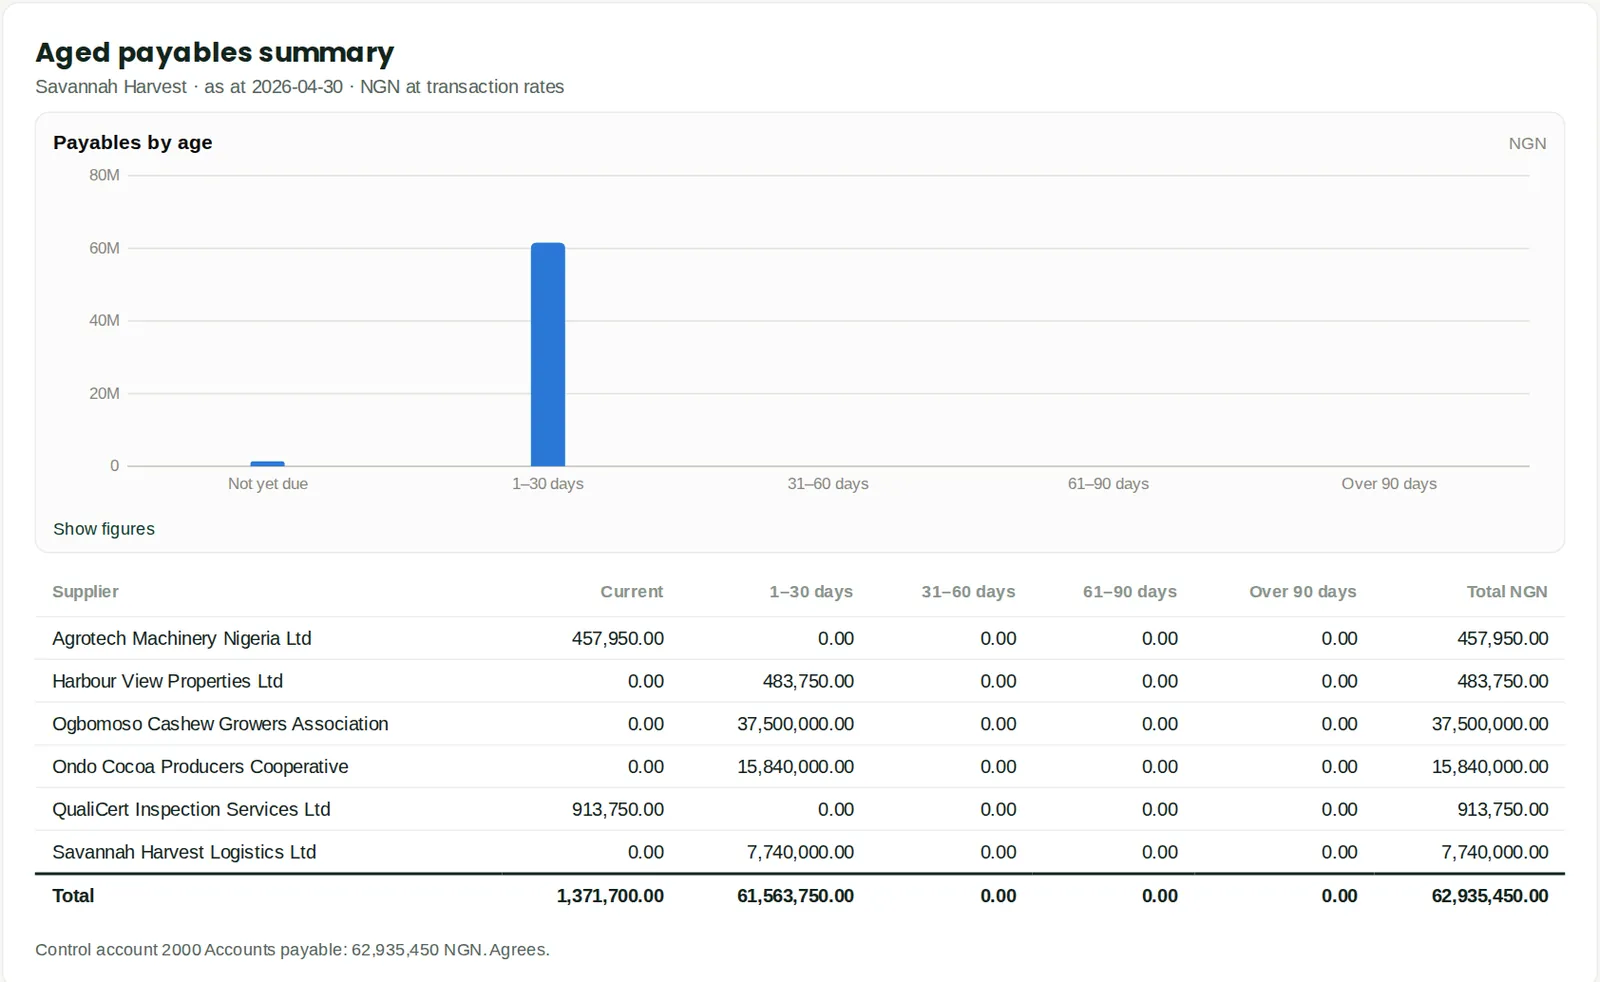
19.22 Aged payables summary
Why
Supplier balances by age, reconciled to the control account.
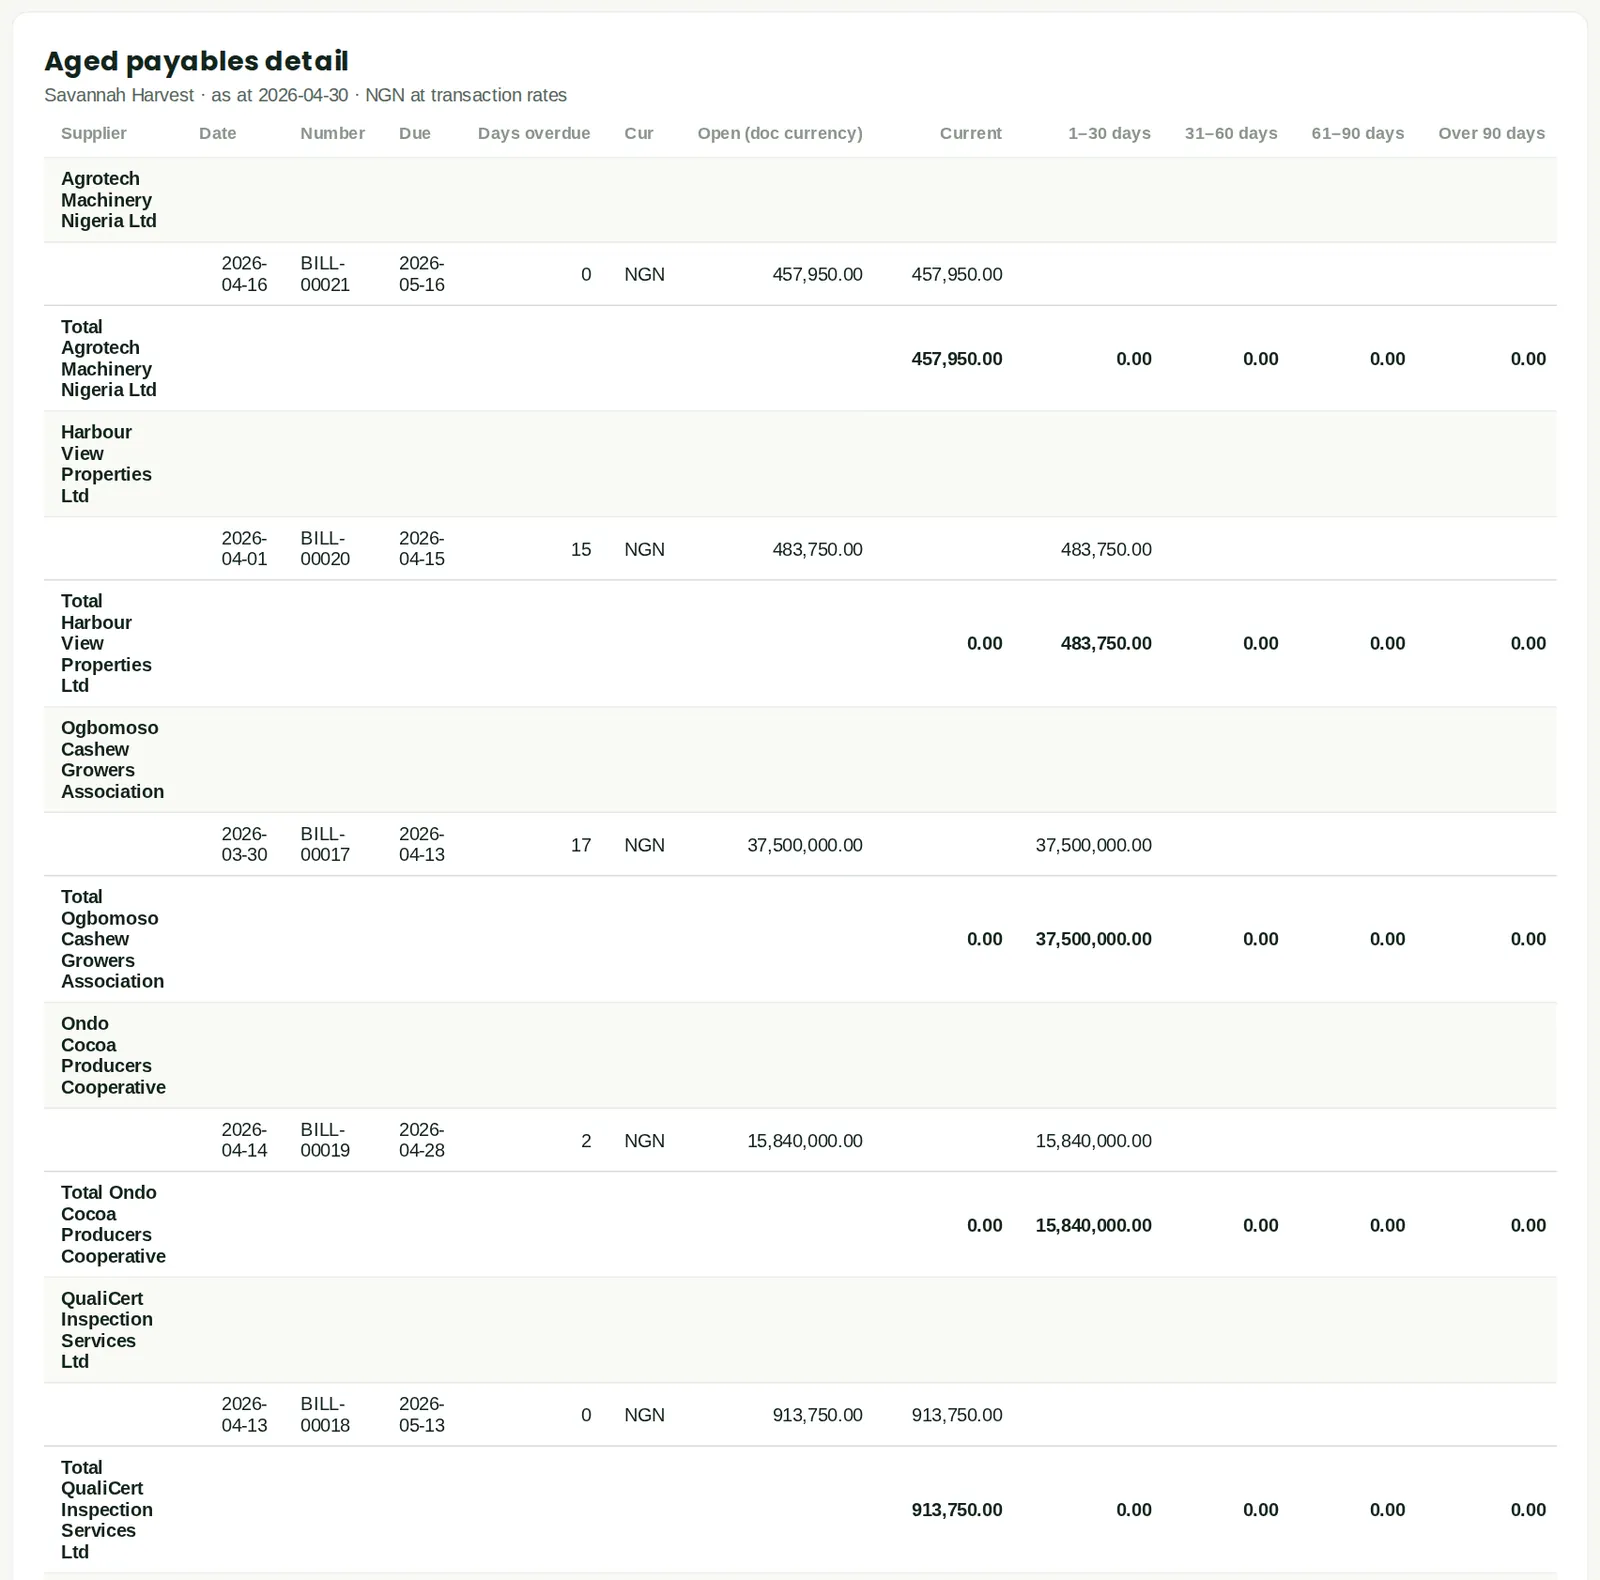
19.23 Aged payables detail
Why
Every open bill and vendor credit.
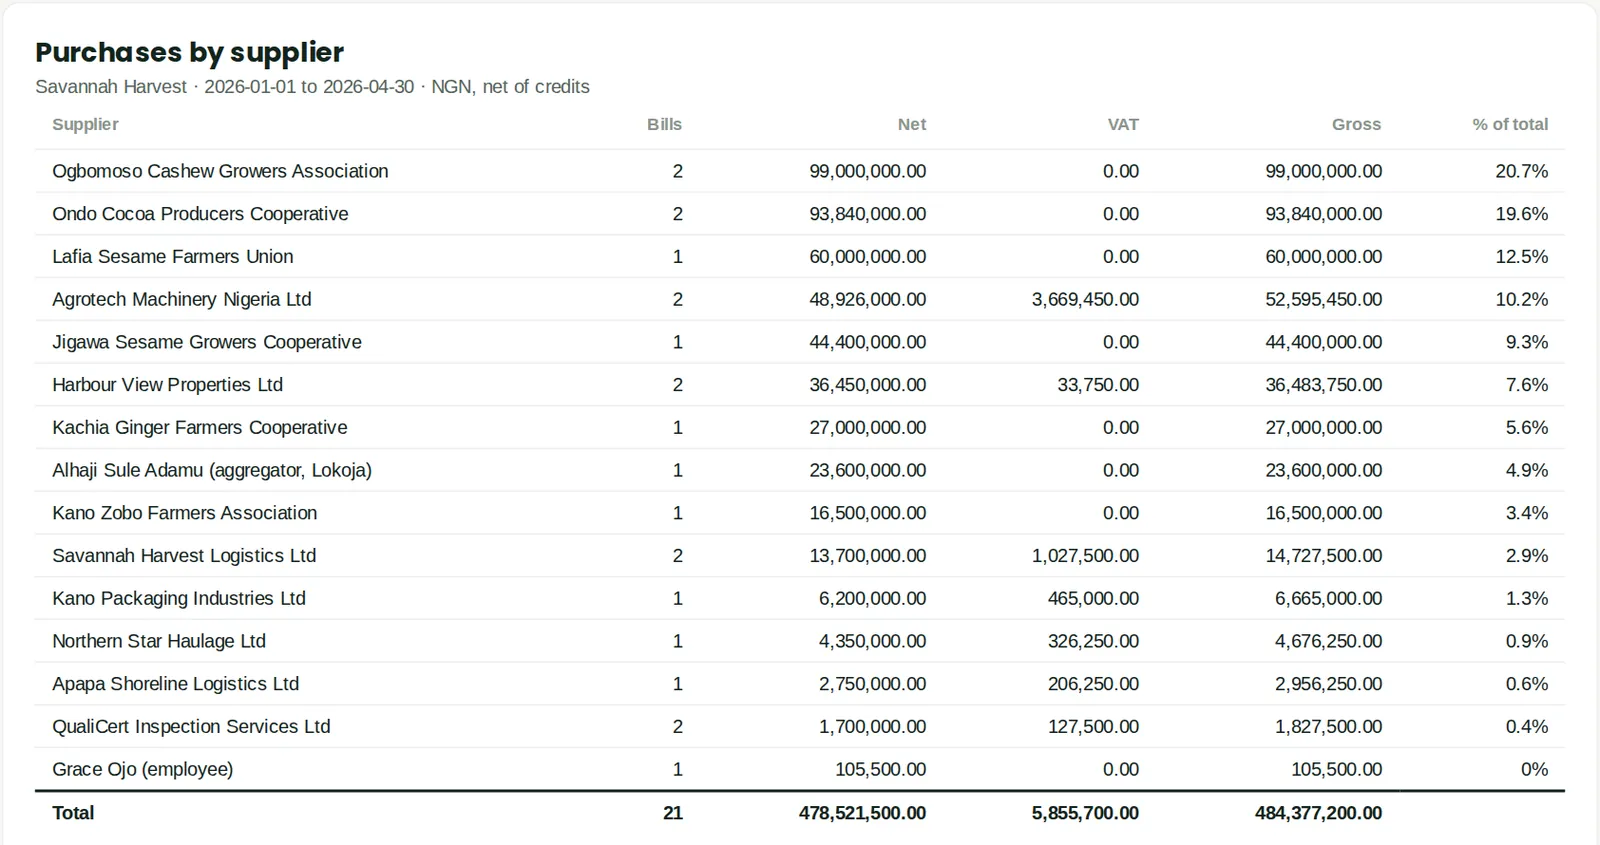
19.24 Purchases by supplier
Why
Net purchases per supplier.
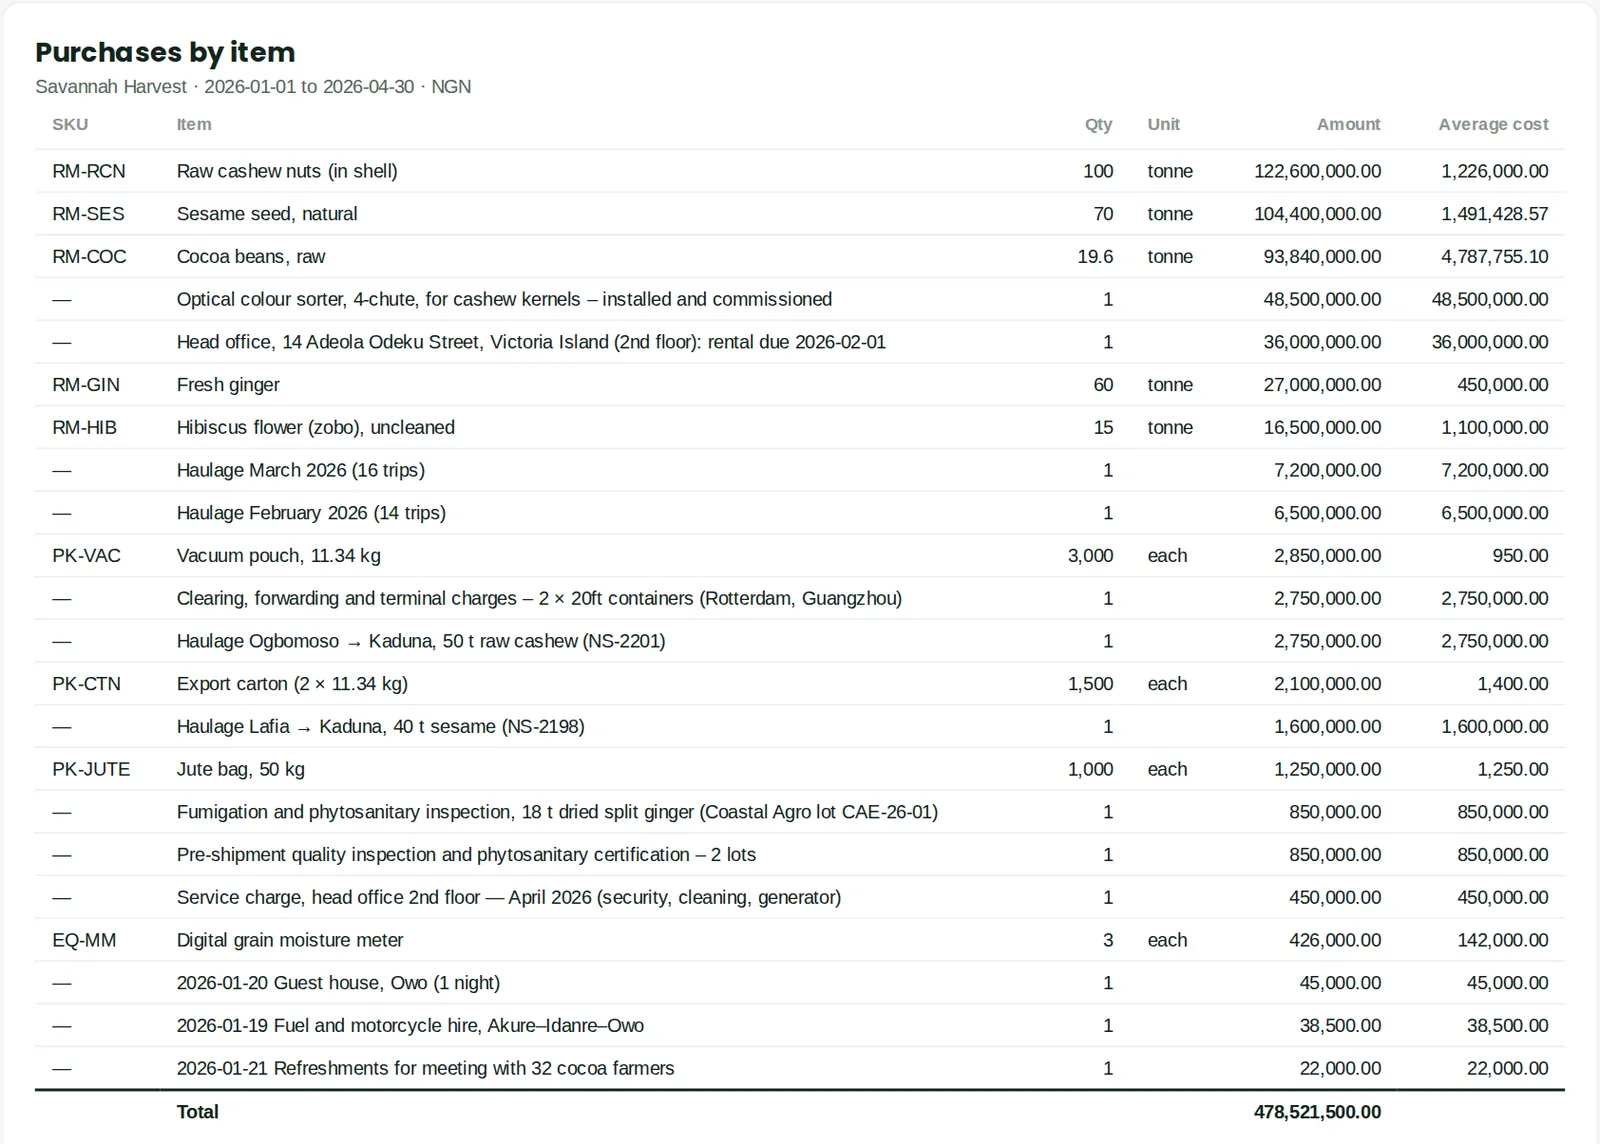
19.25 Purchases by item
Why
Quantity and average cost per item.
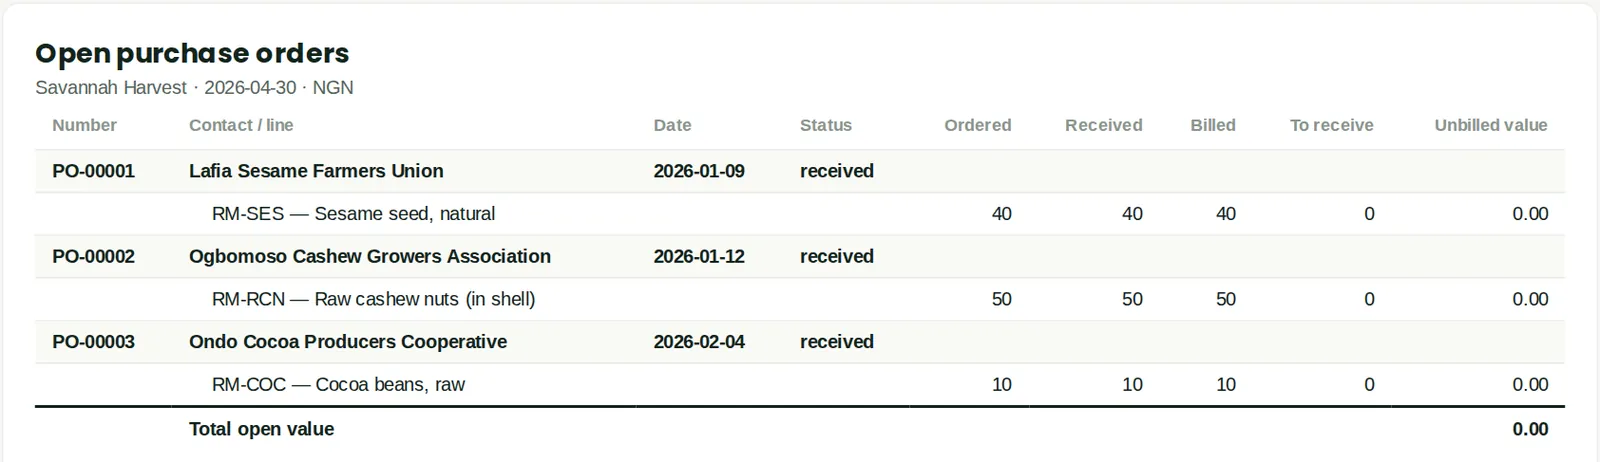
19.26 Open purchase orders
Why
Ordered but not yet received or billed.
19.27 Goods received not invoiced

Why
Receipts awaiting a supplier bill, reconciled to the GRNI account.
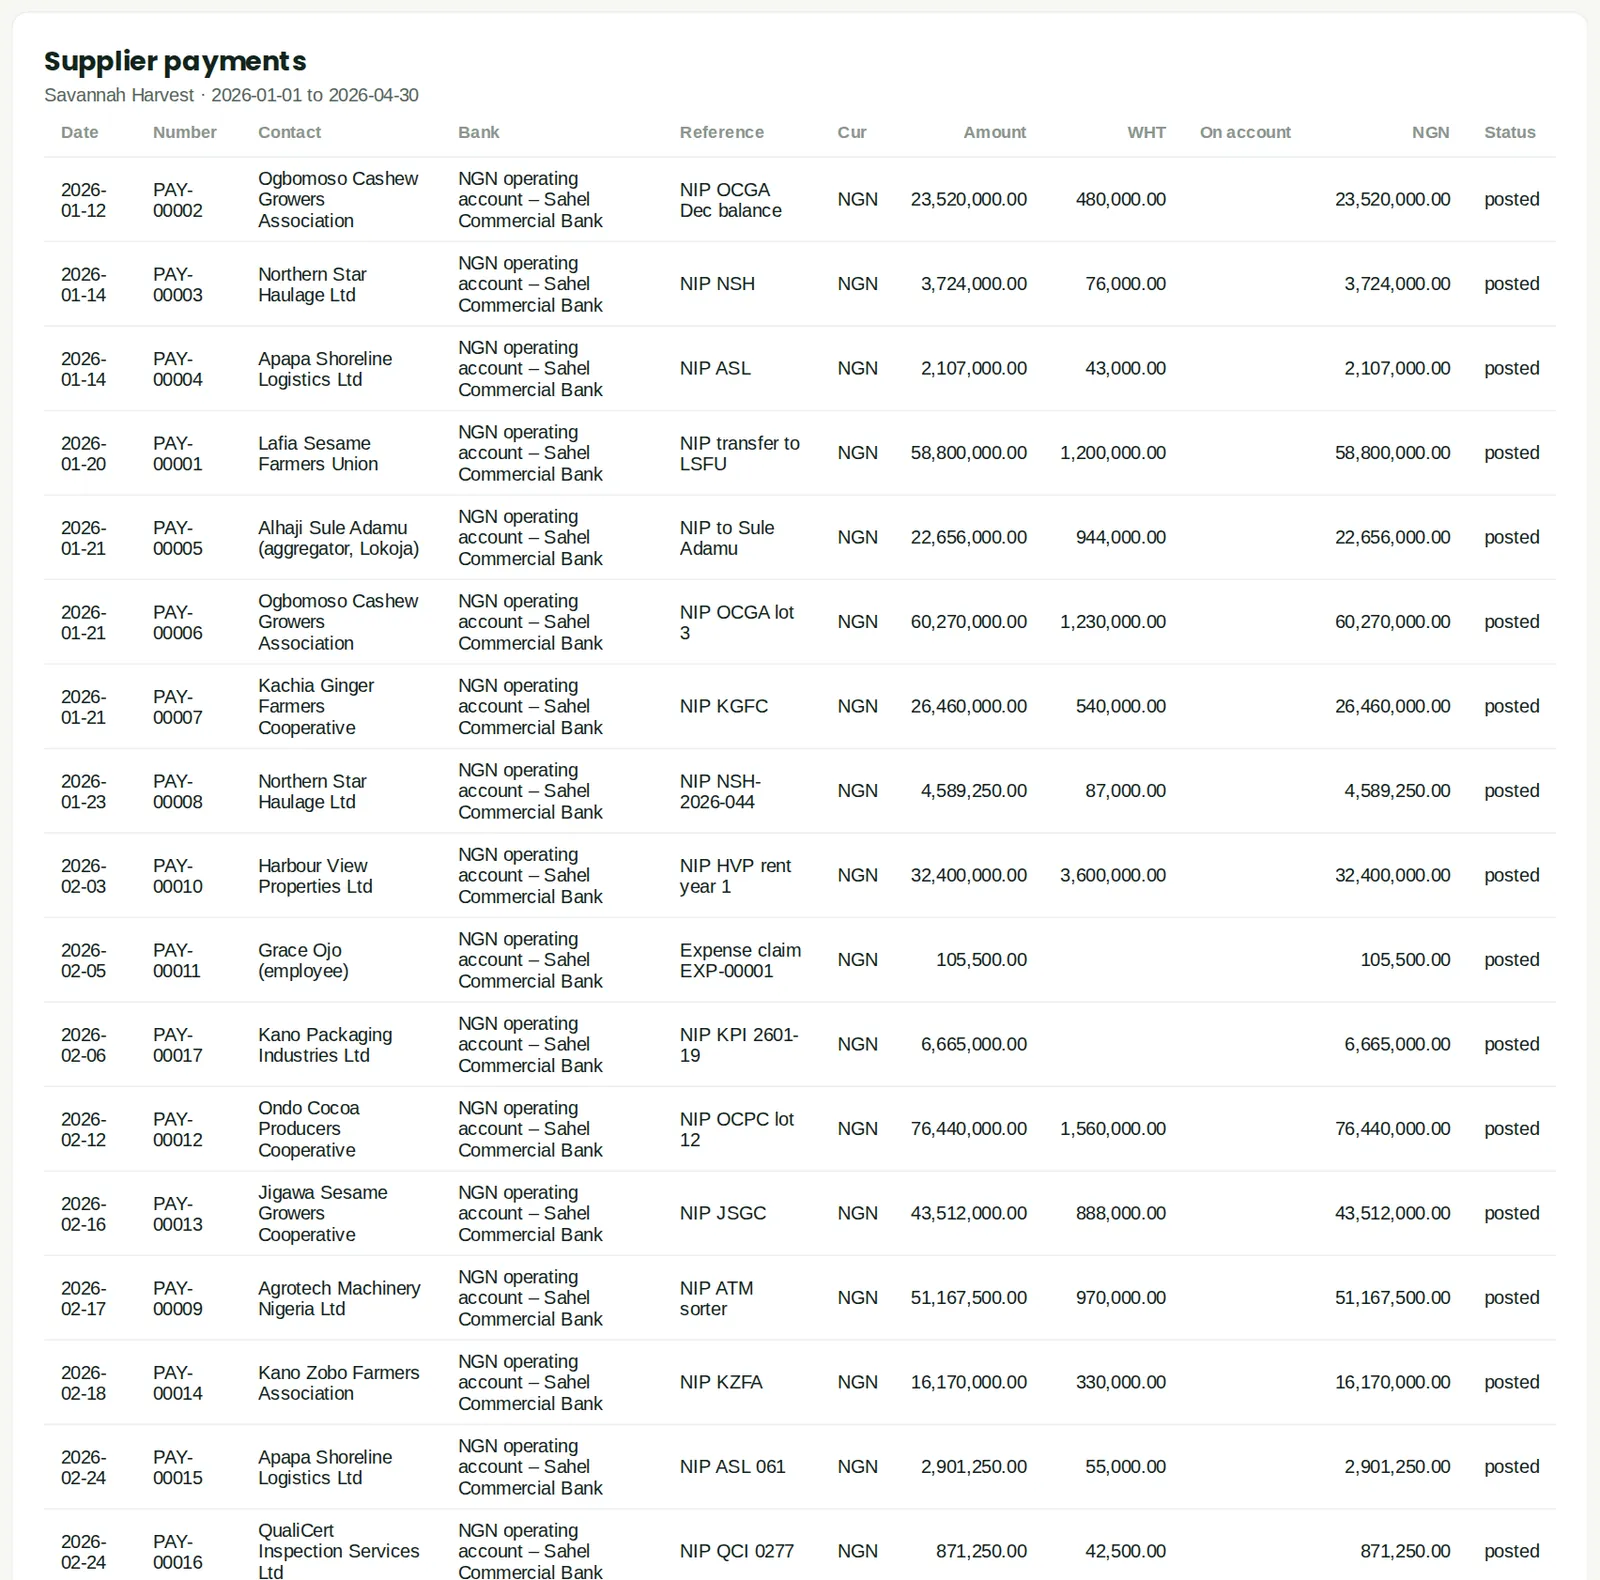
19.28 Supplier payments
Why
Payments made, WHT deducted and unallocated amounts.
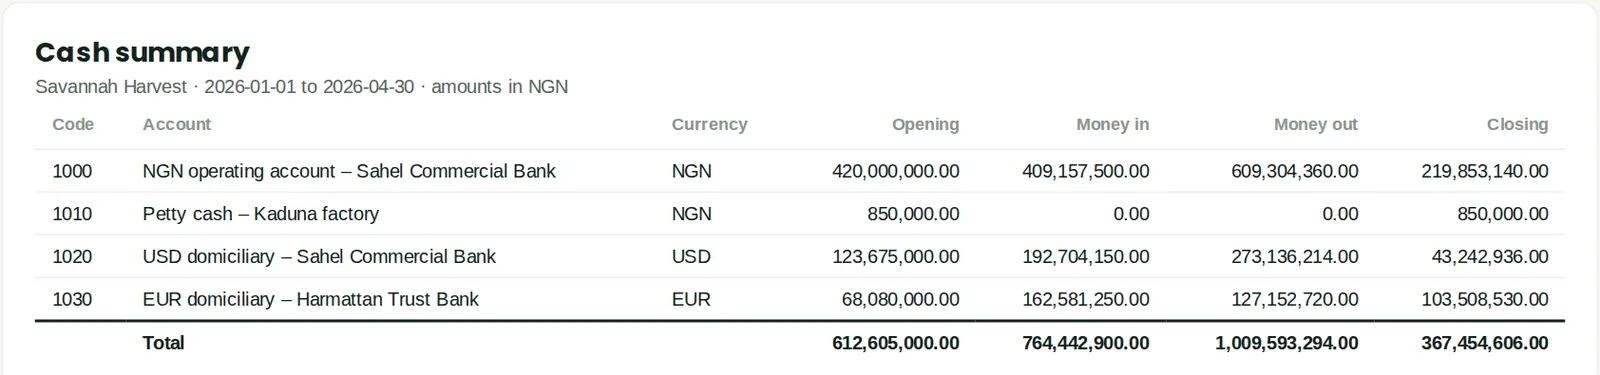
19.29 Cash summary
Why
Opening, money in, money out and closing for each bank account.
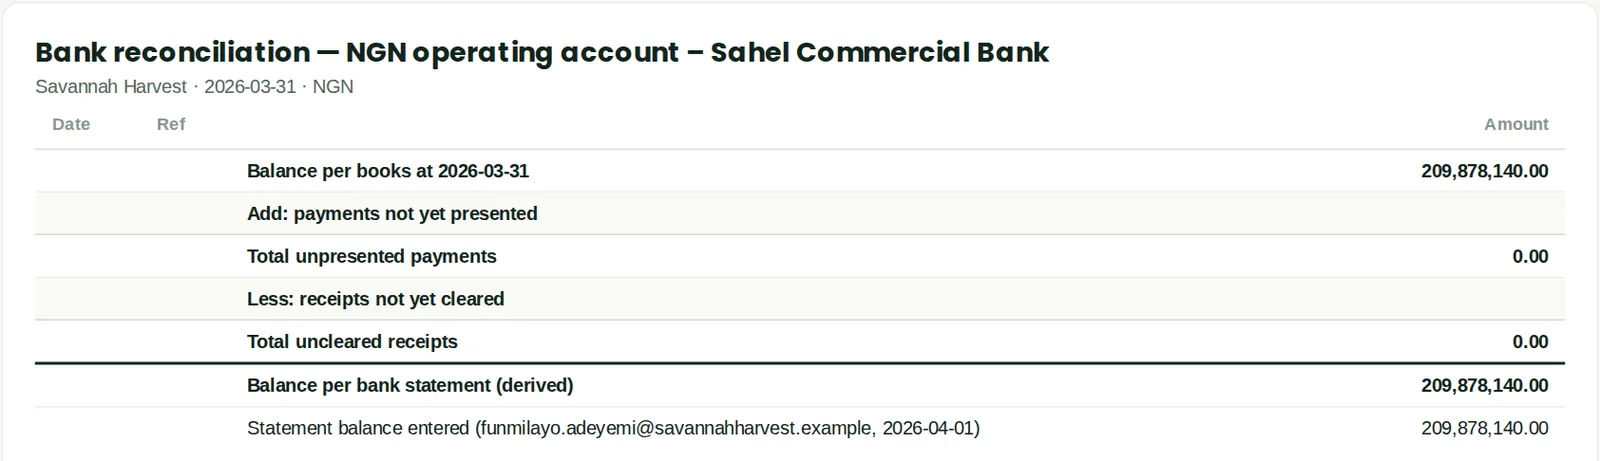
19.30 Bank reconciliation
Why
Statement balance, unpresented items and ledger balance. The latest reconciliation of the naira operating account, at 31 March.
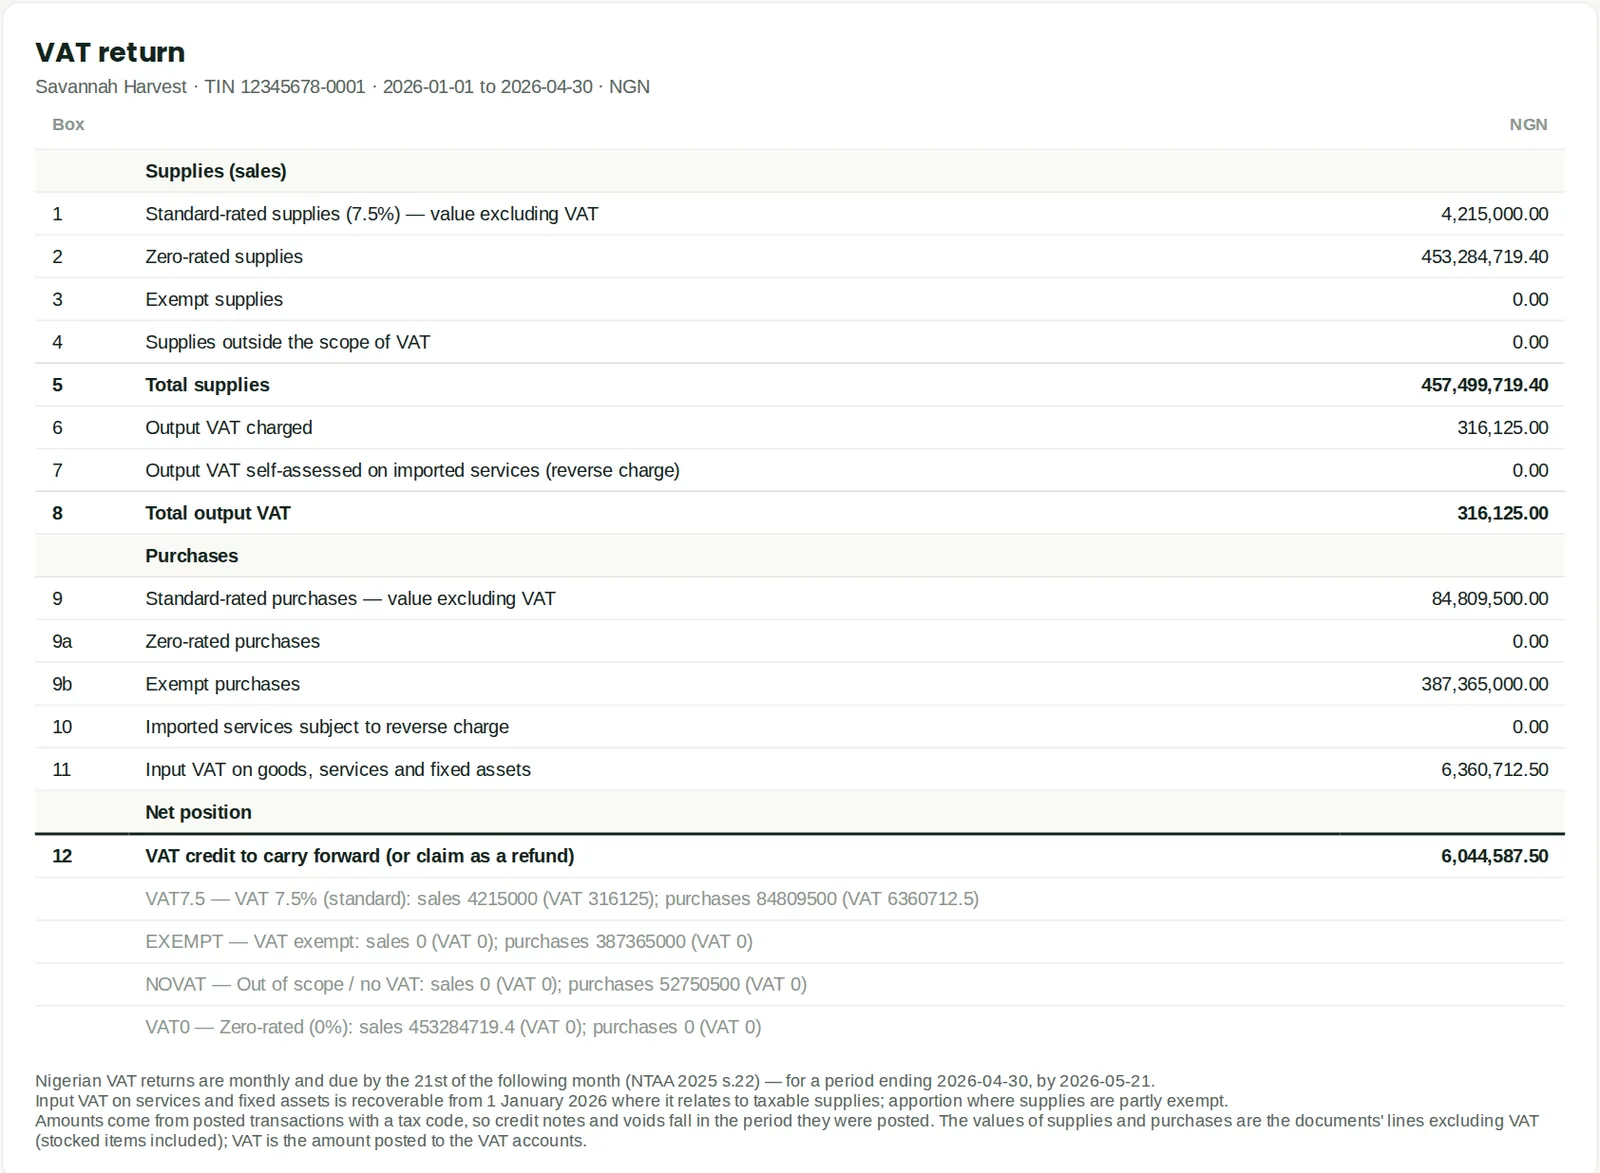
19.31 VAT return
Why
Output VAT, input VAT, zero-rated, exempt and reverse-charge boxes for the NRS return.
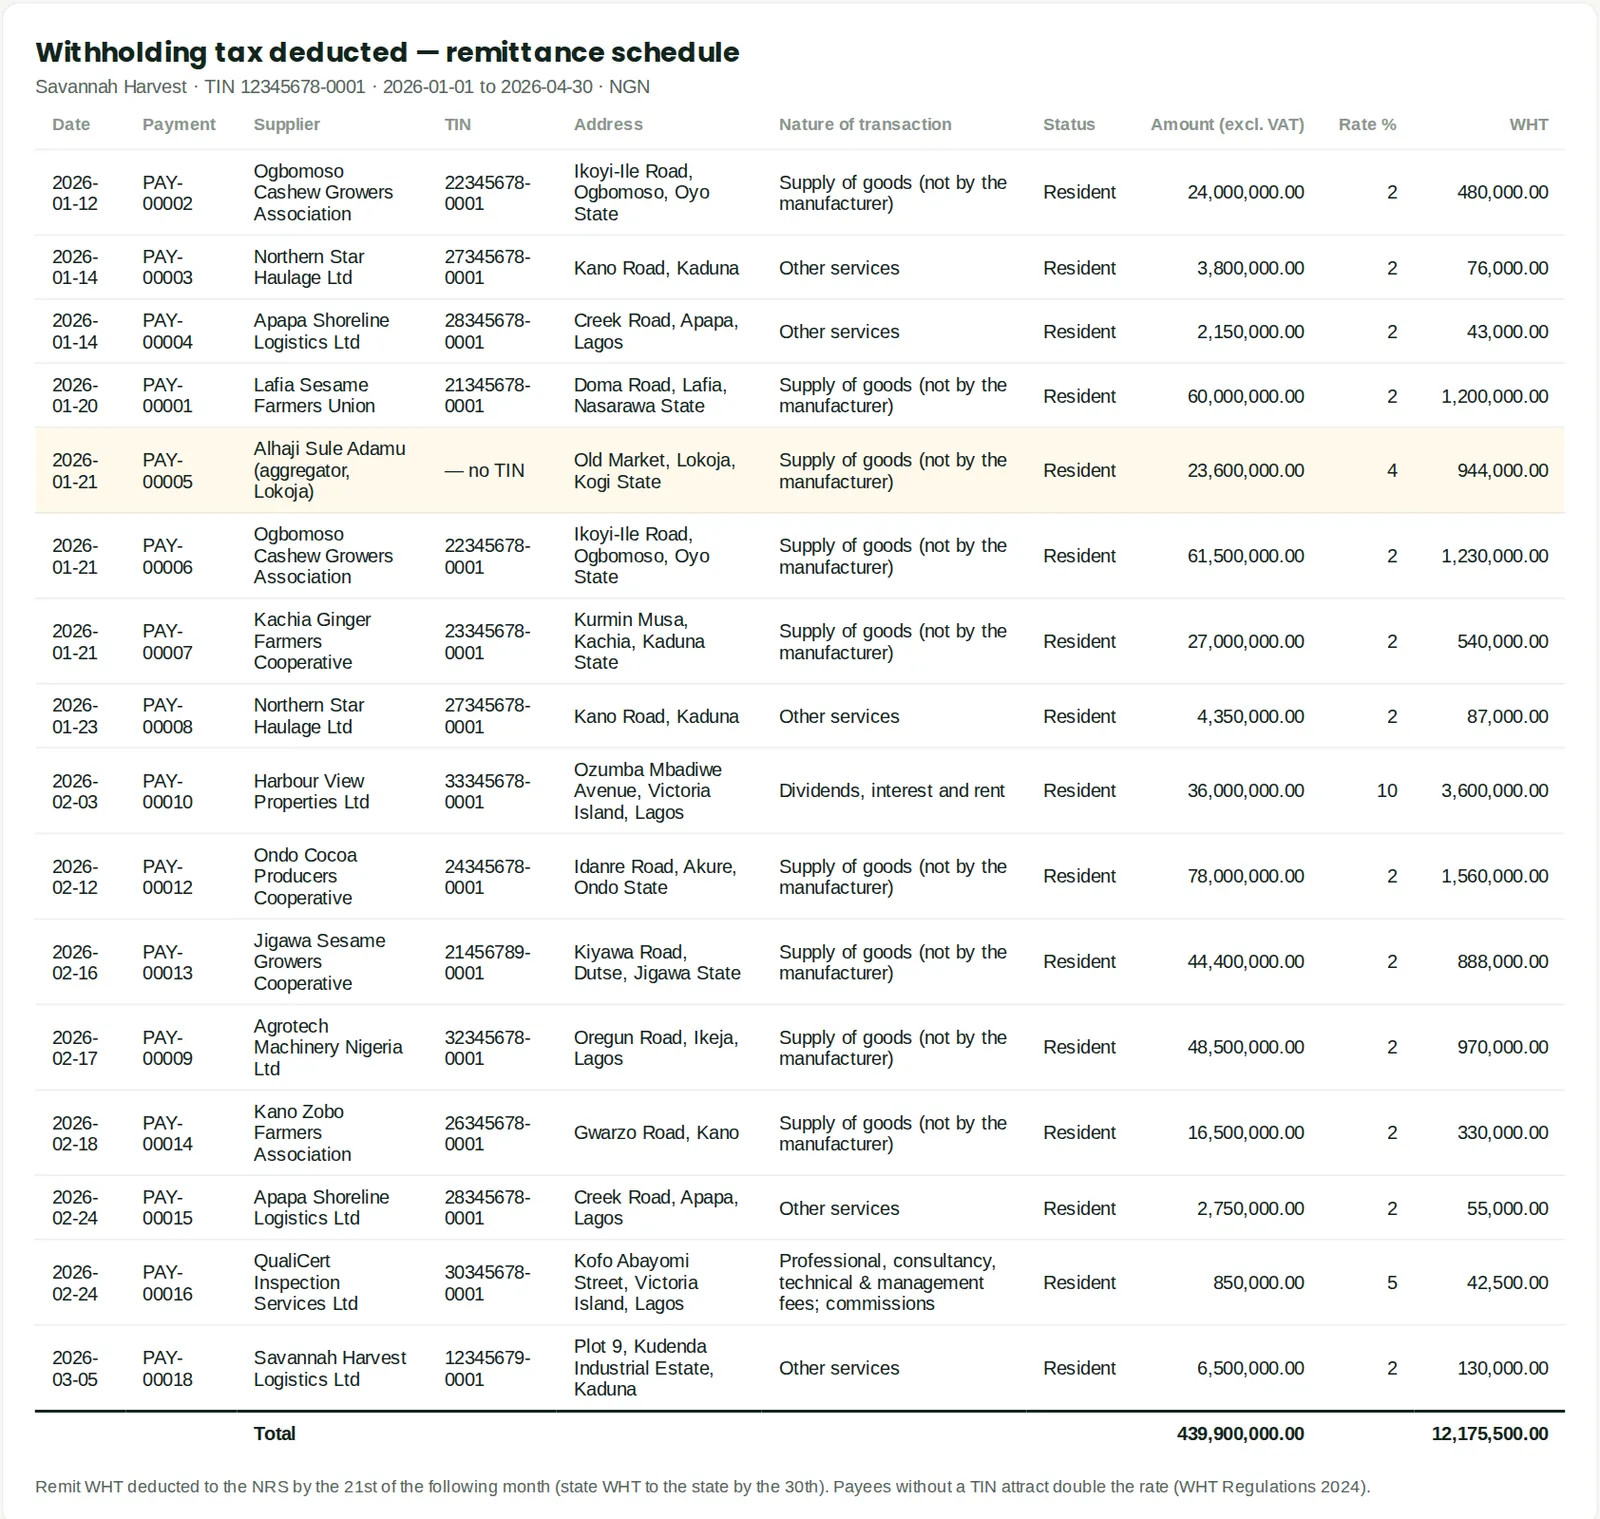
19.32 WHT deducted (to remit)
Why
Withholding tax deducted from suppliers, with TINs — for the monthly remittance schedule.
19.33 WHT suffered (credit notes due)

Why
WHT deducted by customers — collect the credit notes to offset income tax. Empty in Savannah Harvest: no customer deducted WHT from it (the subsidiary's credit note is in chapter 17).
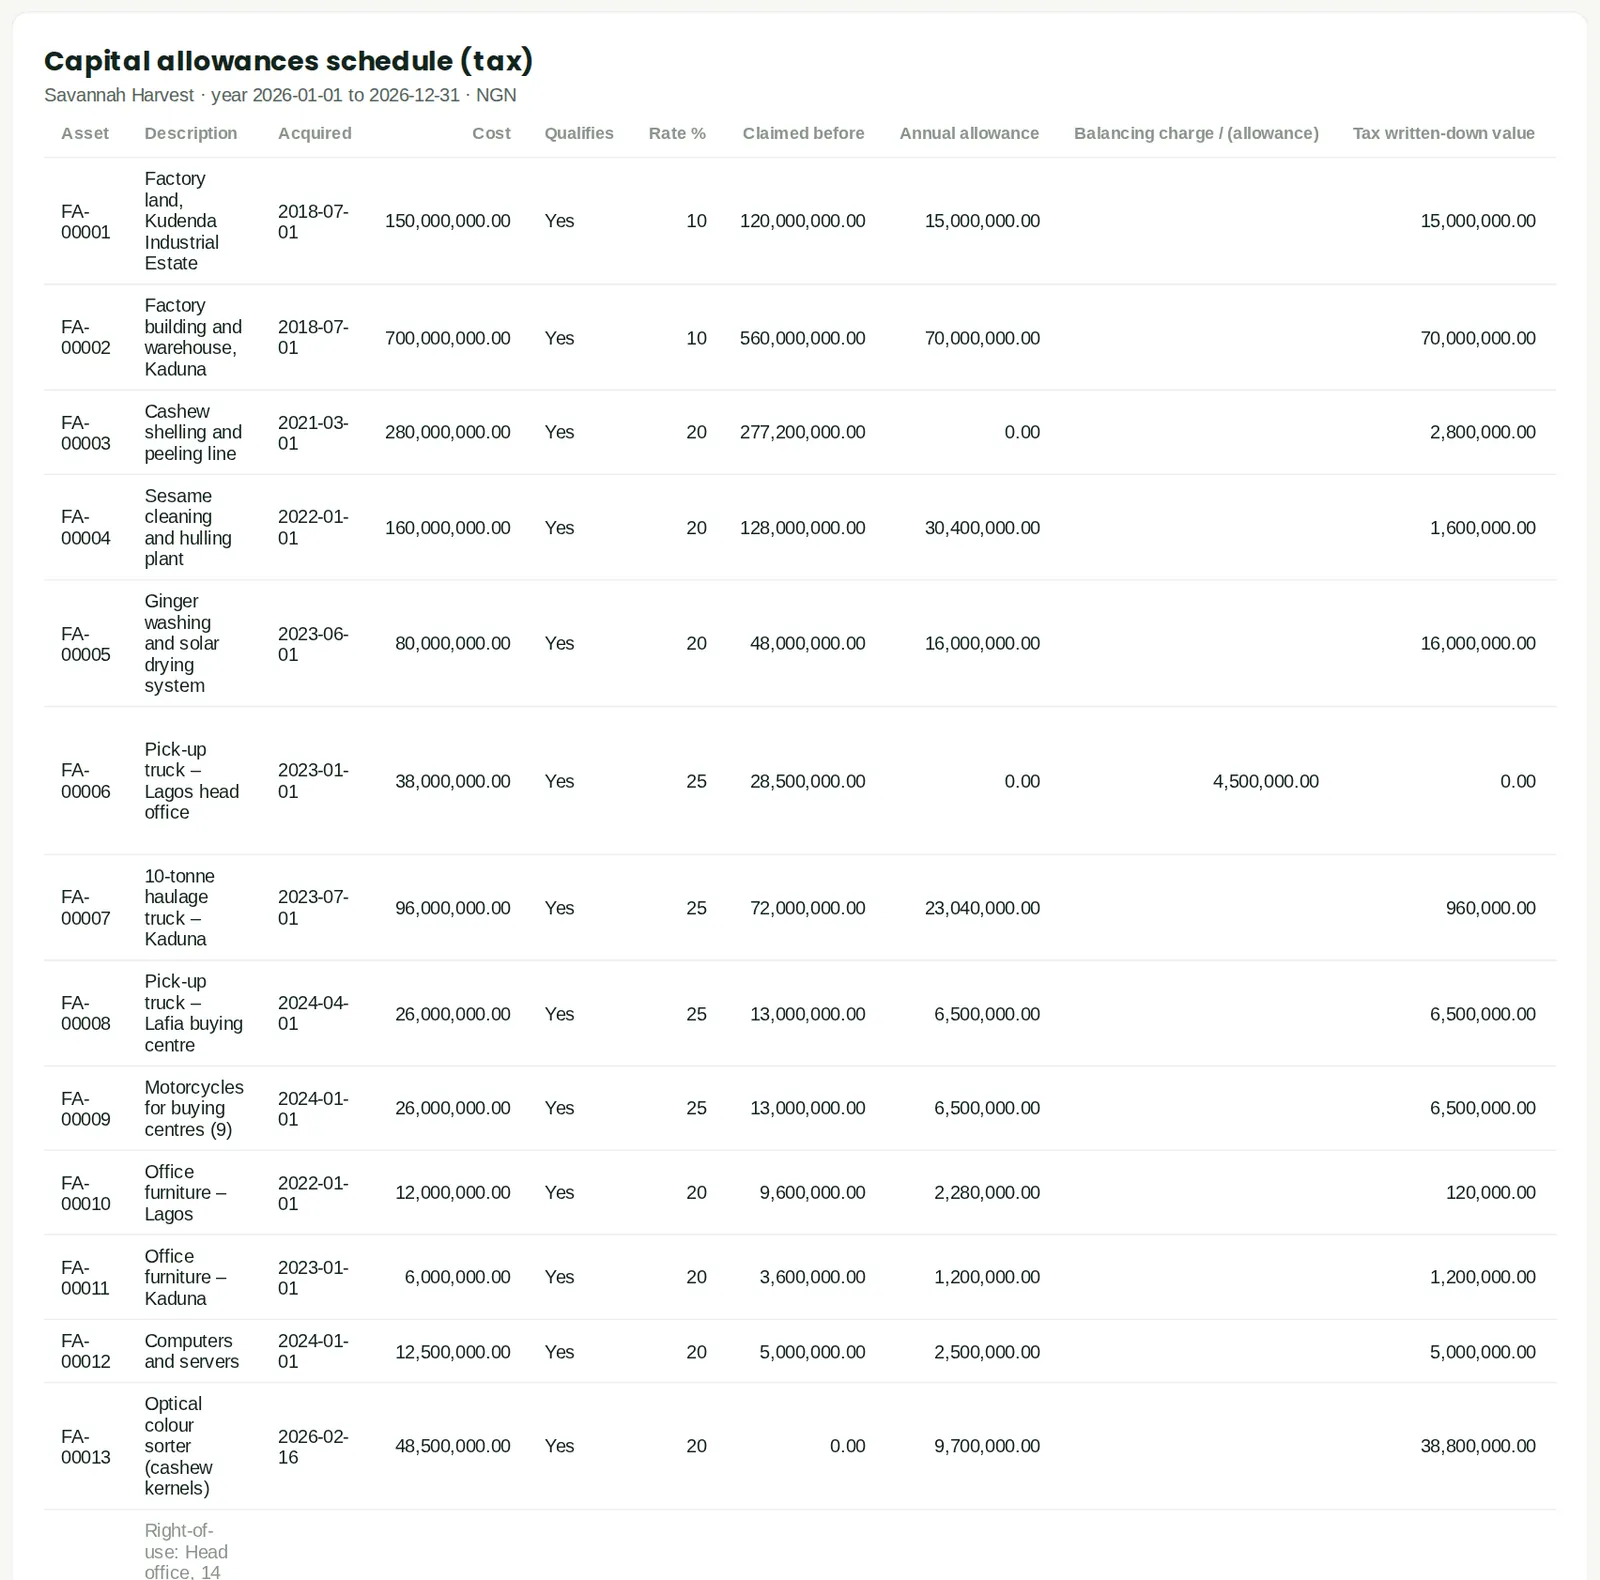
19.34 Capital allowances schedule
Why
Annual allowances, balancing adjustments and tax written-down values (Nigeria Tax Act 2025).
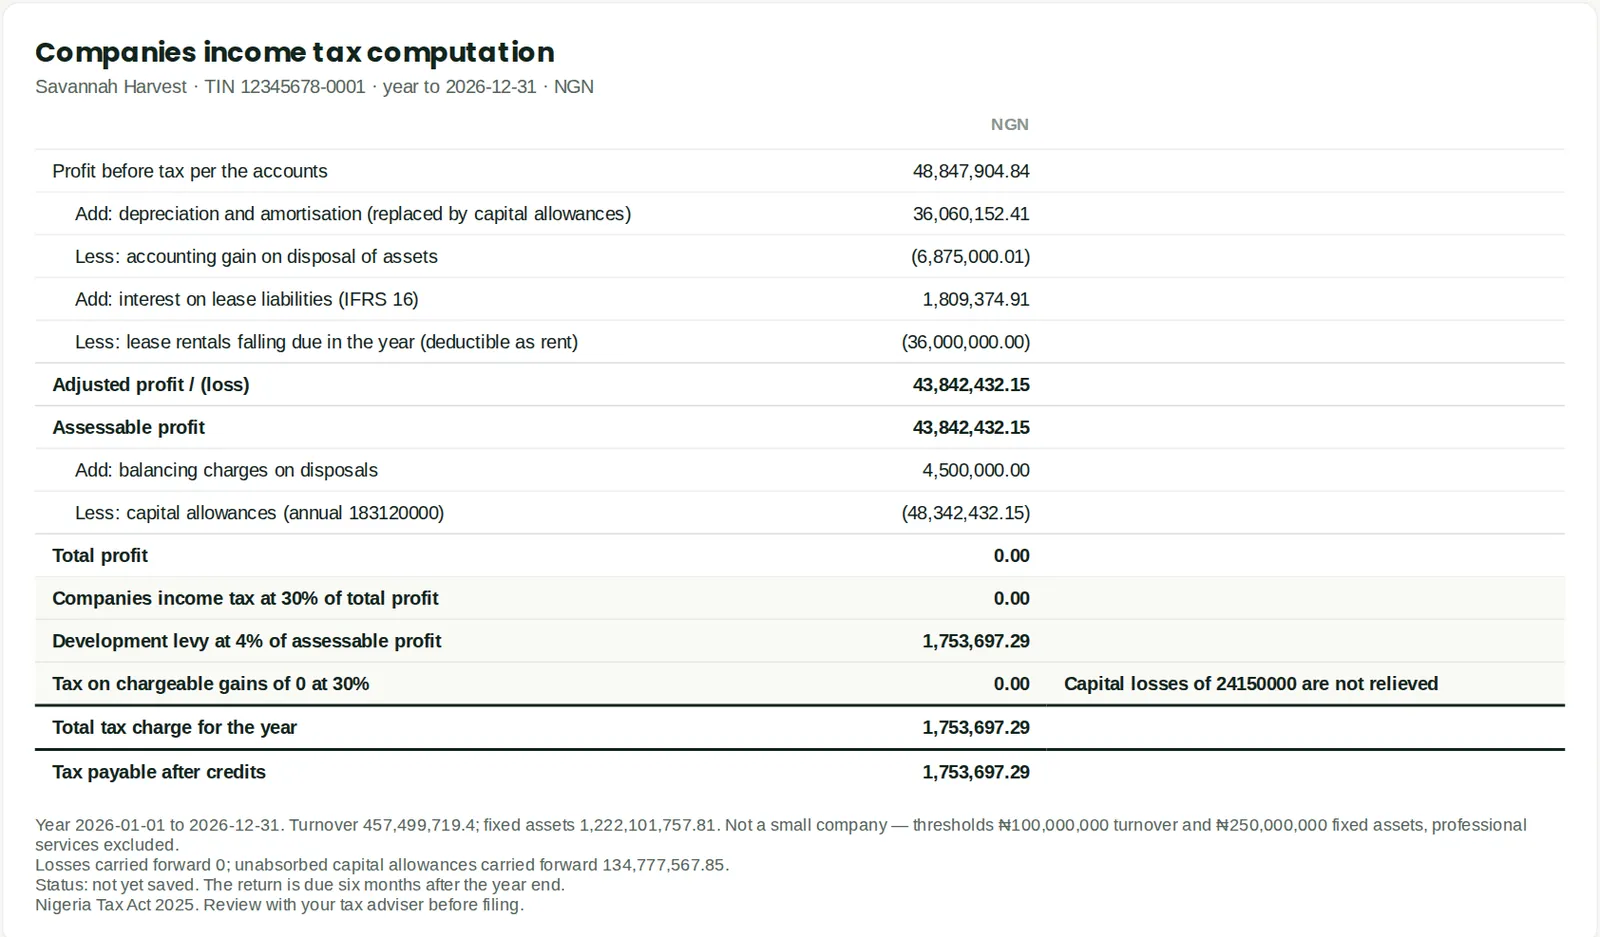
19.35 Companies income tax computation
Why
Adjusted profit, losses, capital allowances, CIT, development levy, minimum-tax check and WHT credit set-off.
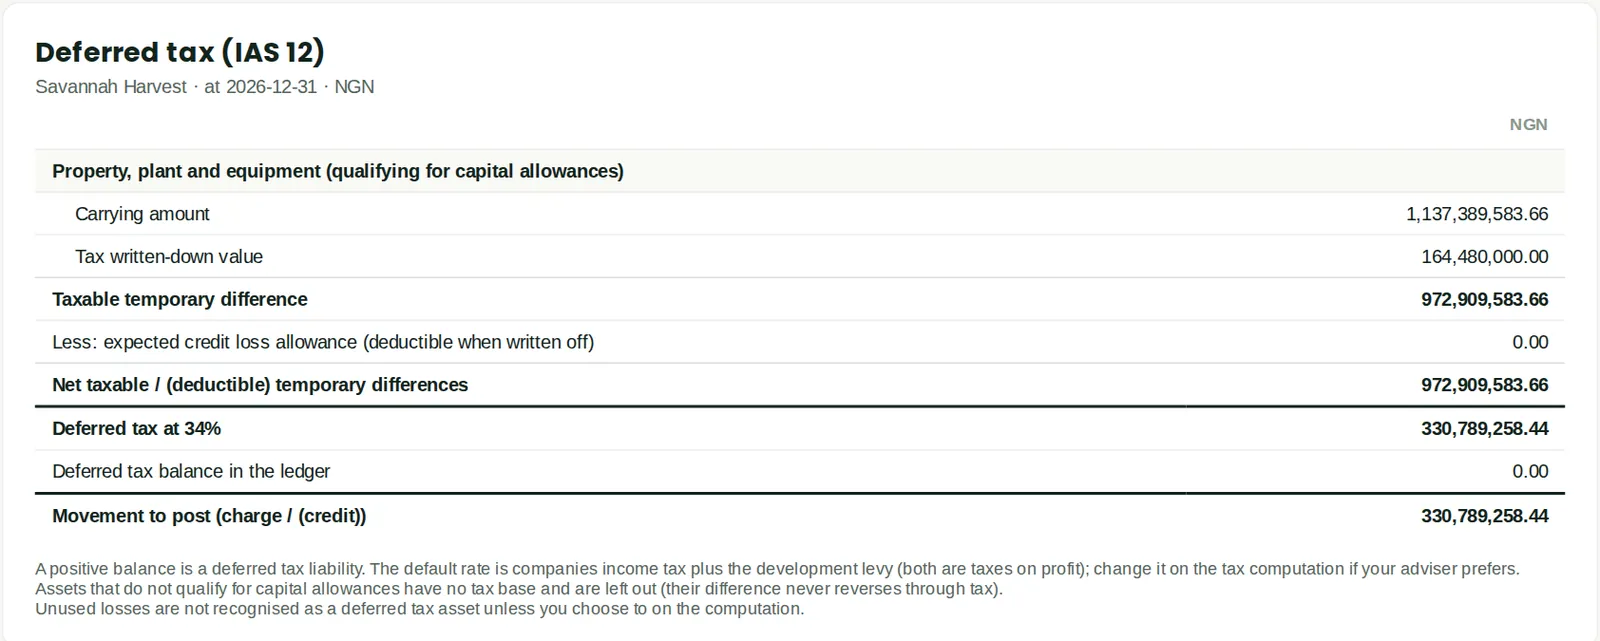
19.36 Deferred tax (IAS 12)
Why
Temporary differences on PPE, provisions and losses, and the movement to post. See chapter 17: the tax written-down values from before 2026 were not brought in, so the difference is overstated.
19.37 WHT credit notes

Why
WHT deducted by customers against credit notes received — what is still to collect. Empty in Savannah Harvest; see chapter 17 for the subsidiary.
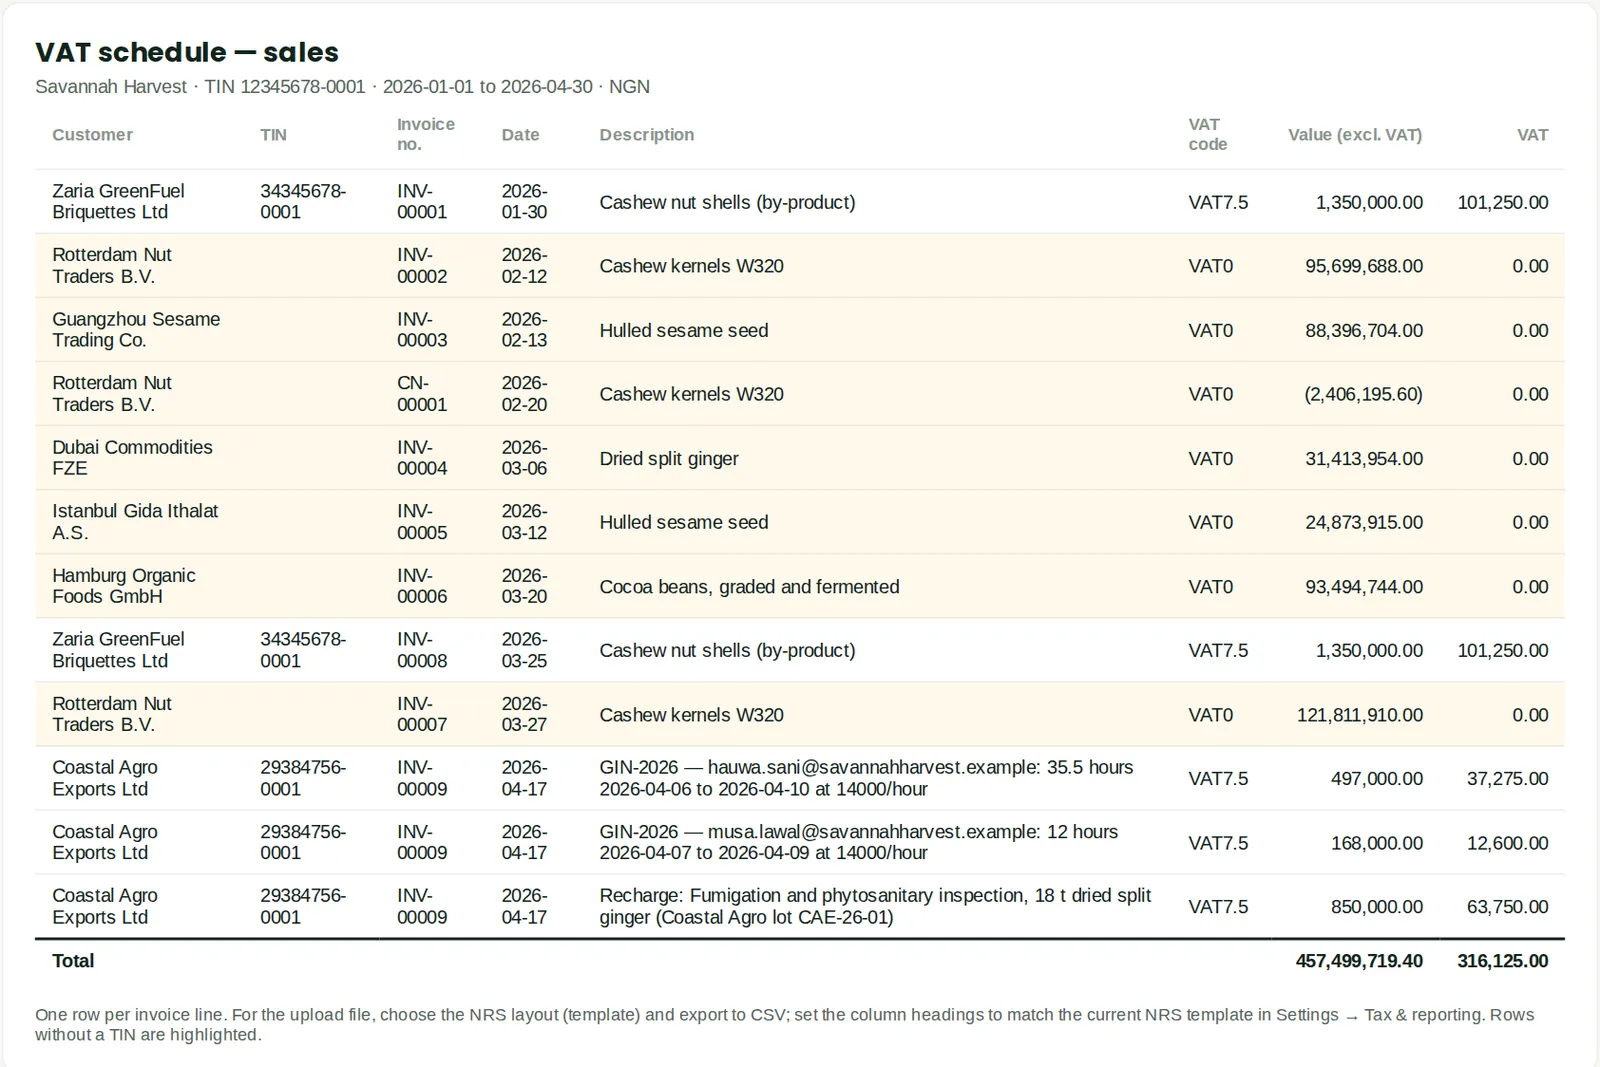
19.38 VAT schedule (for the portal upload)
Why
Invoice-level output or input VAT schedule with TINs — standard, or in the NRS upload column layout set in Settings.
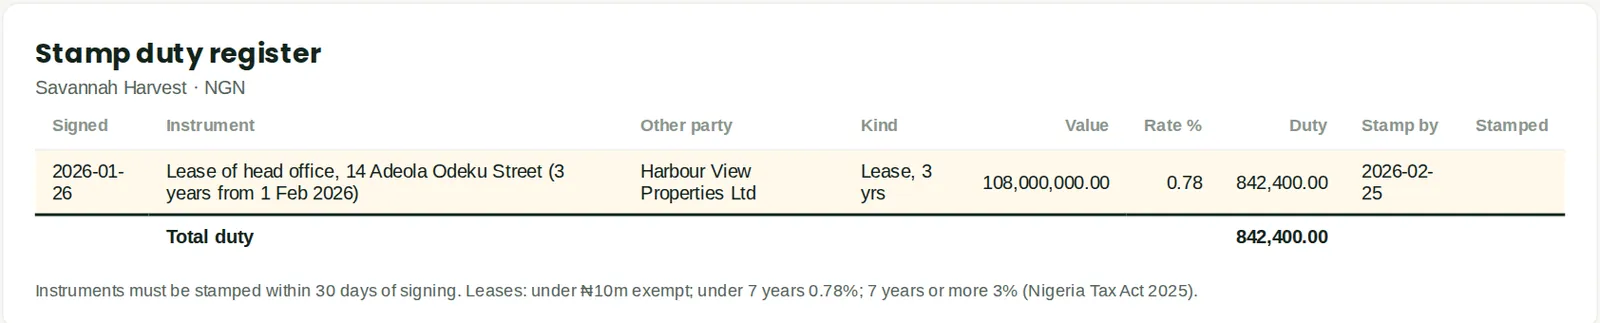
19.39 Stamp duty register
Why
Instruments signed, duty and stamping deadlines.
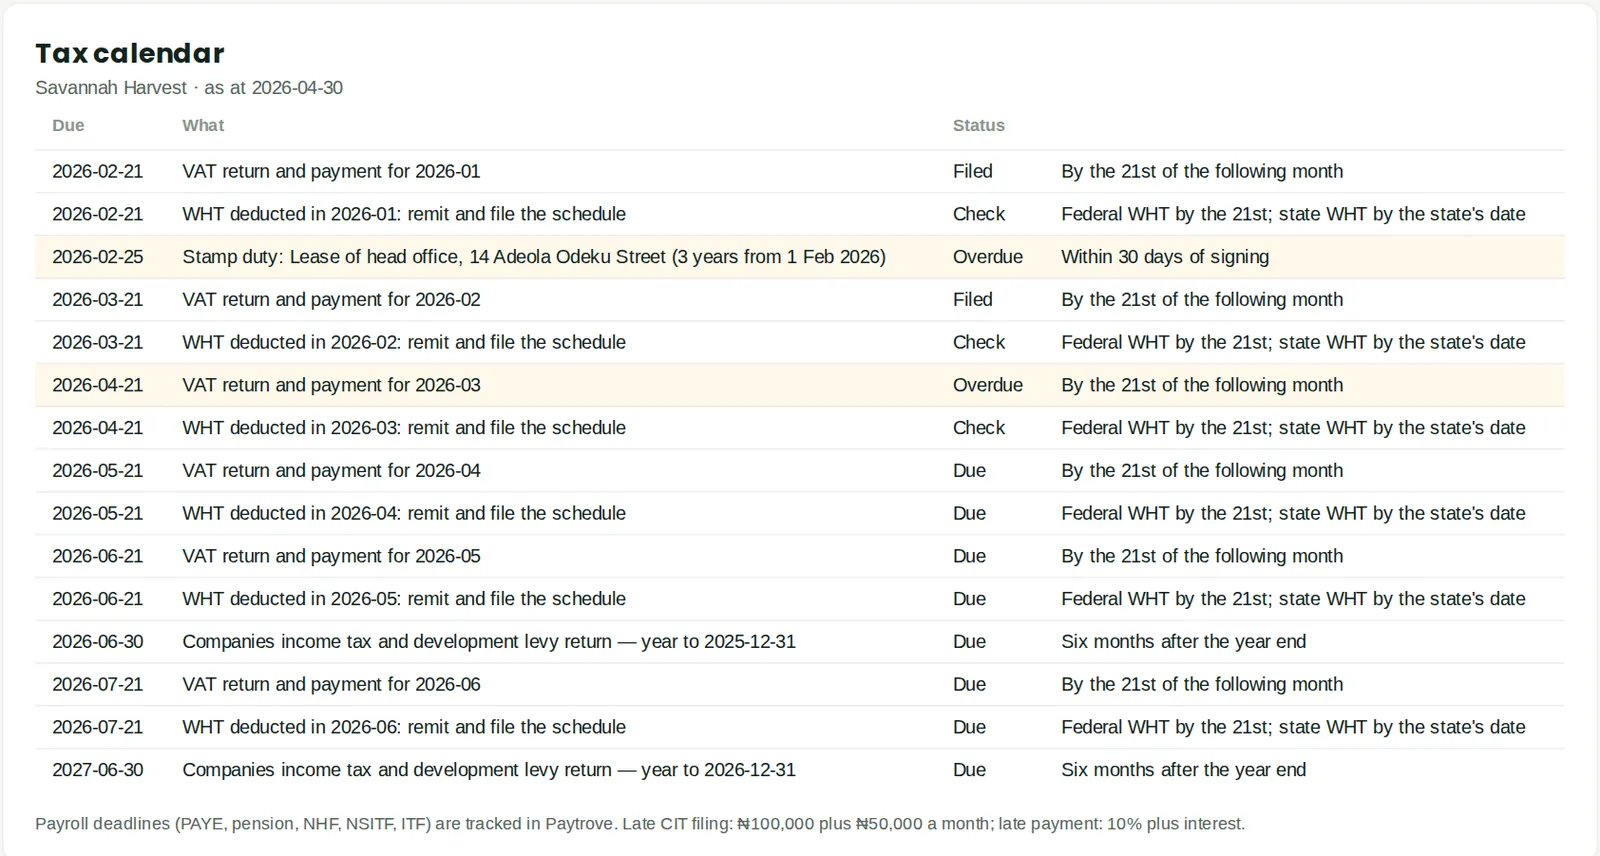
19.40 Tax calendar
Why
VAT, WHT, companies income tax and stamp duty deadlines with status.
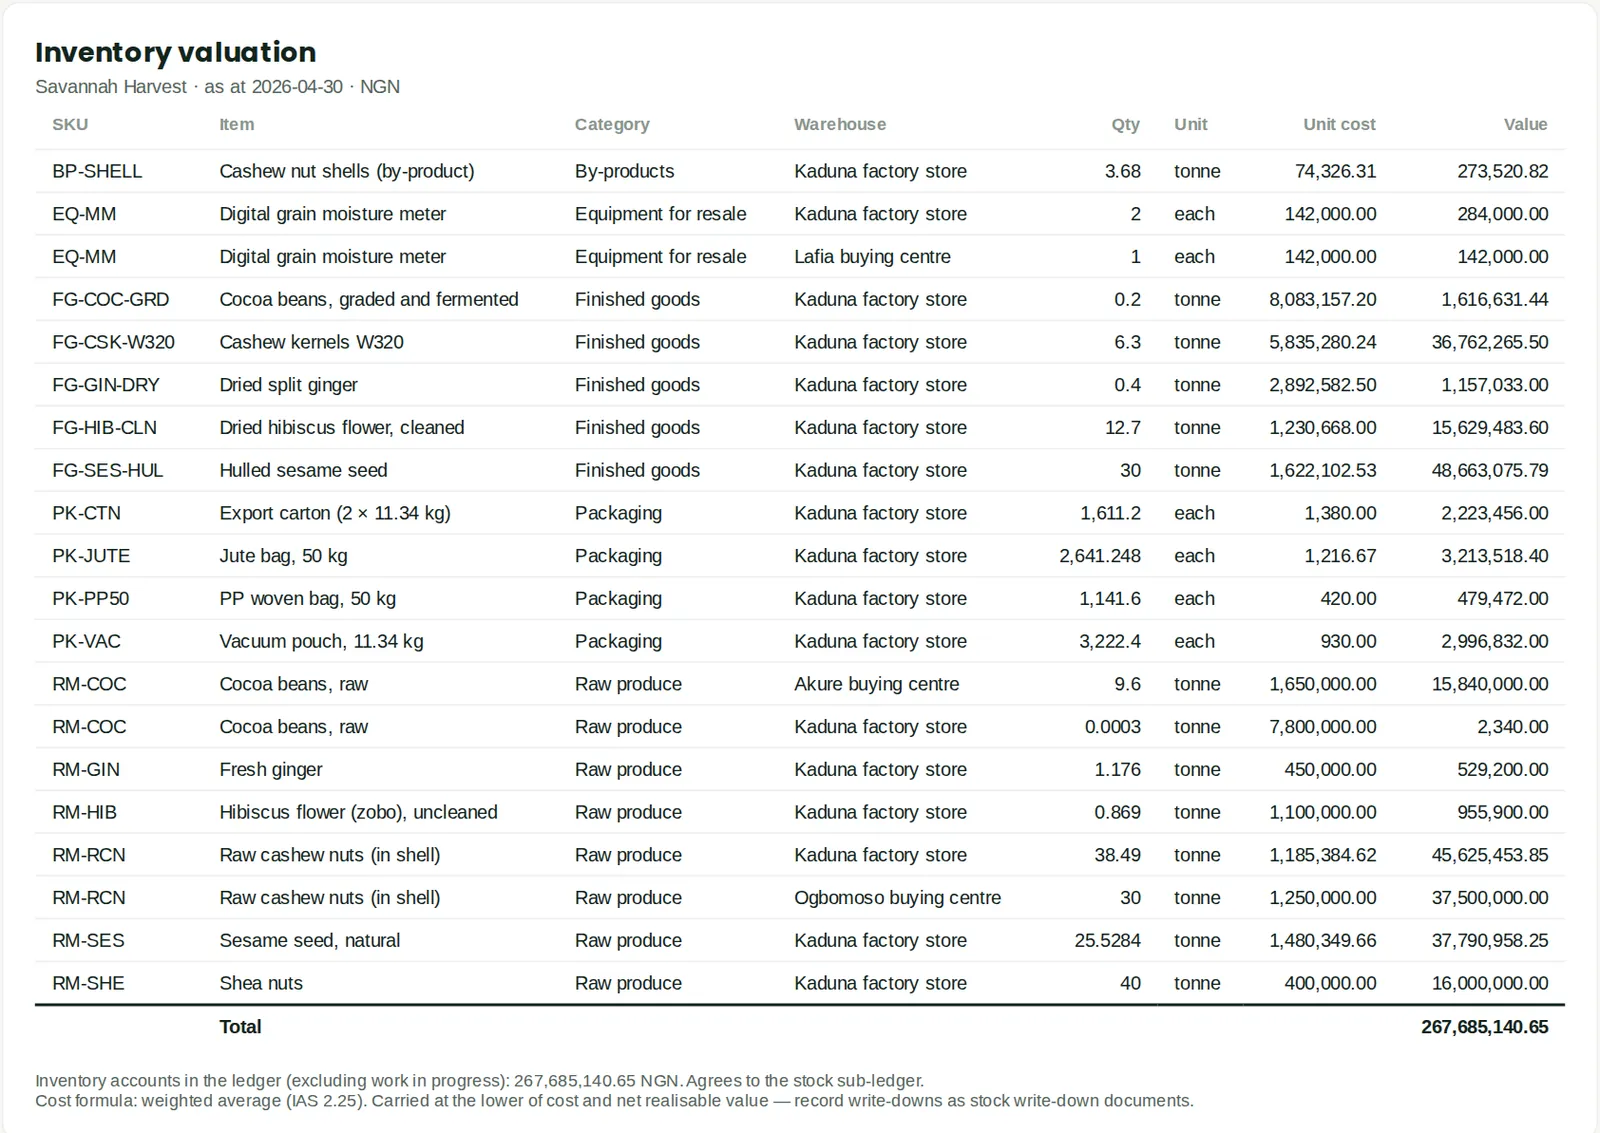
19.41 Inventory valuation
Why
Quantity and value by item and warehouse, reconciled to the stock accounts.
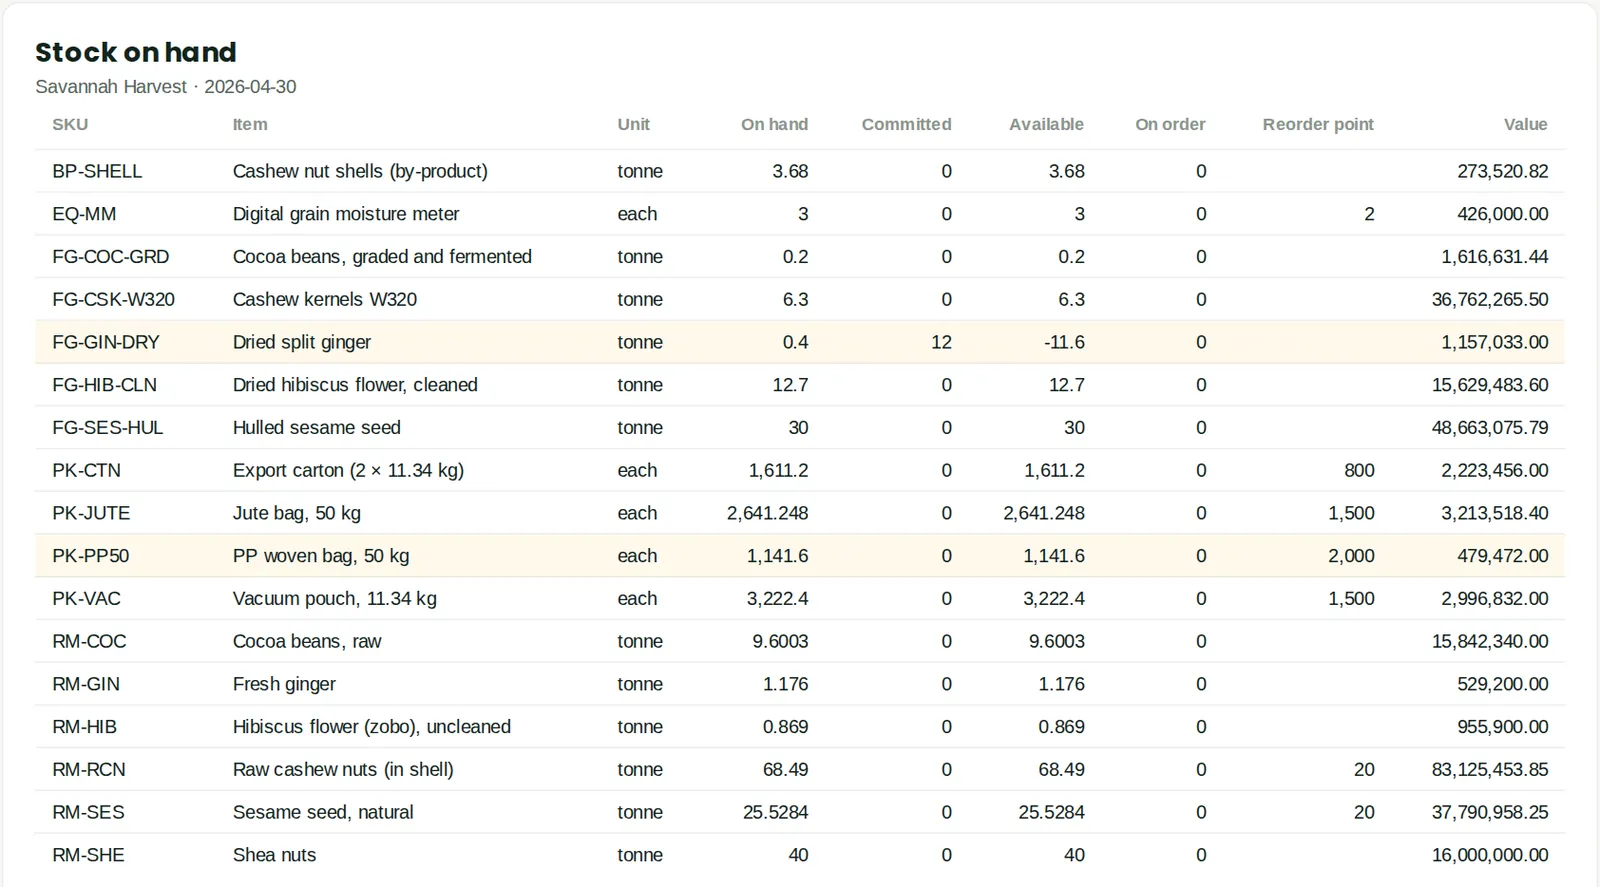
19.42 Stock on hand
Why
On hand, committed to orders and production, available and on order.
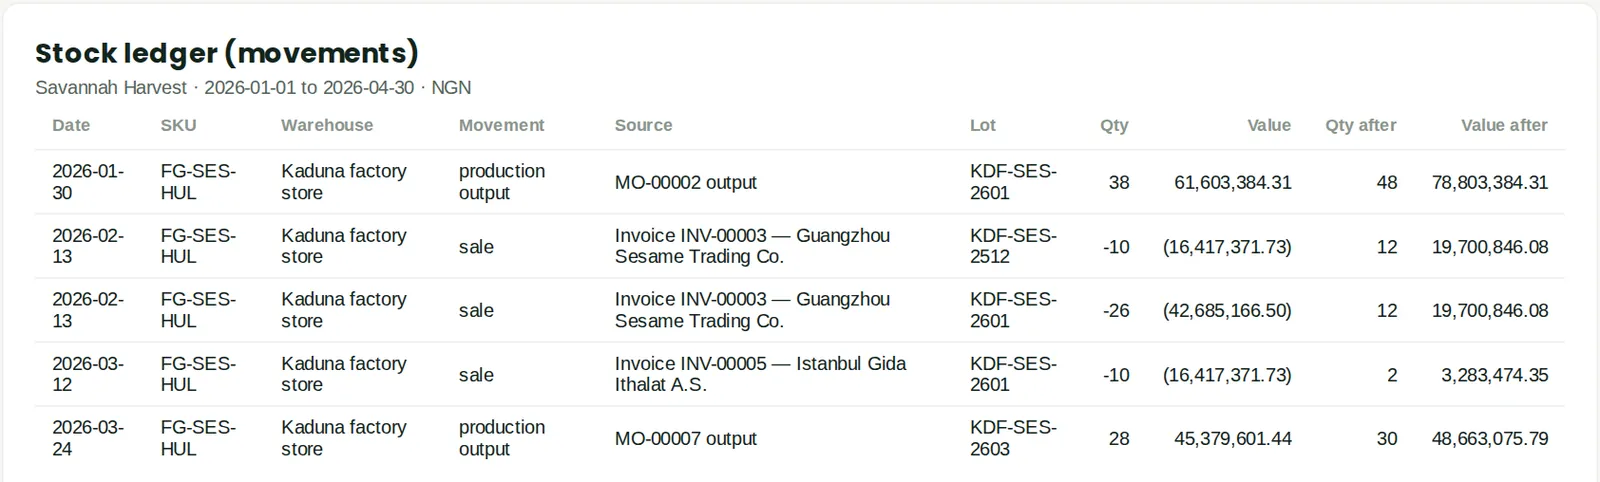
19.43 Stock movement ledger
Why
Every movement with running quantity and value.
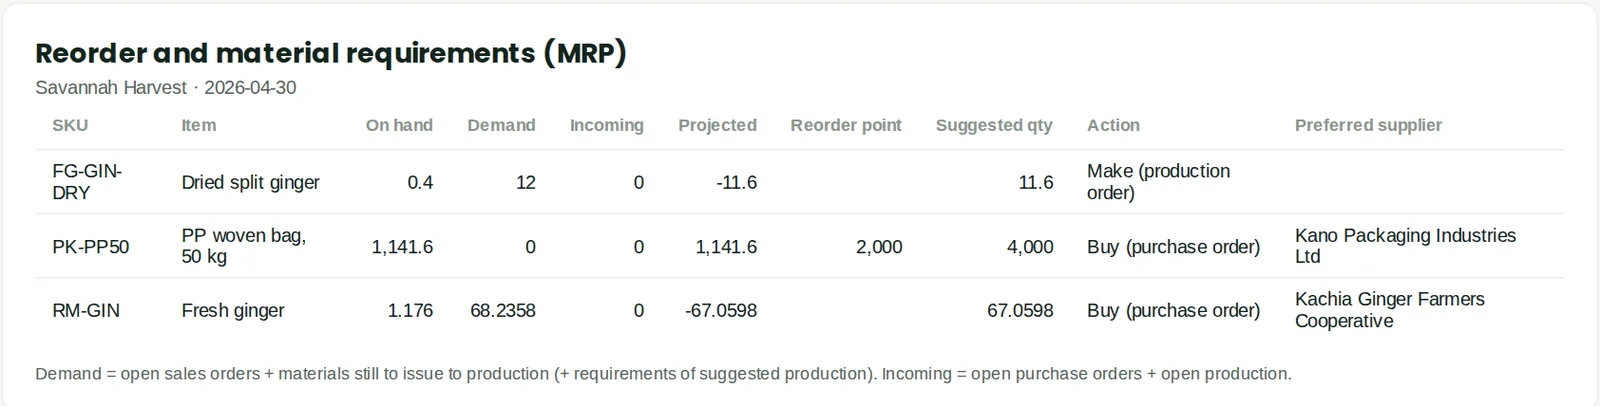
19.44 Reorder and MRP suggestions
Why
What to buy or make, from reorder points, open orders and production demand.
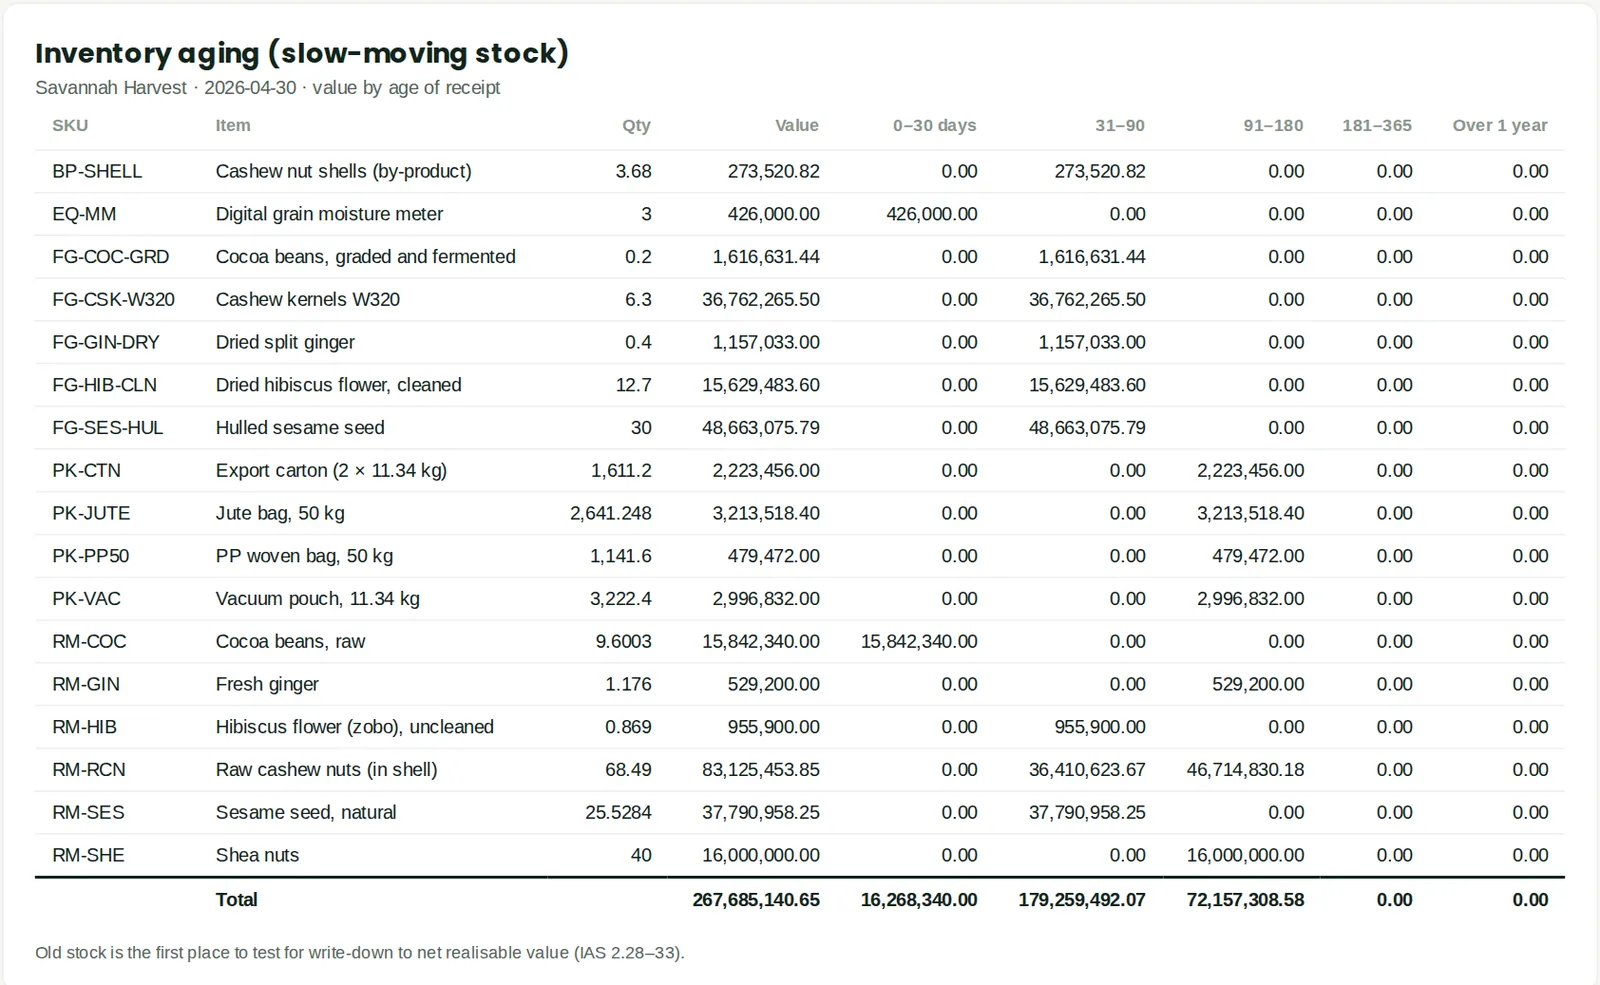
19.45 Inventory aging
Why
How long stock has been held — slow-moving and obsolete stock (IAS 2 NRV review).
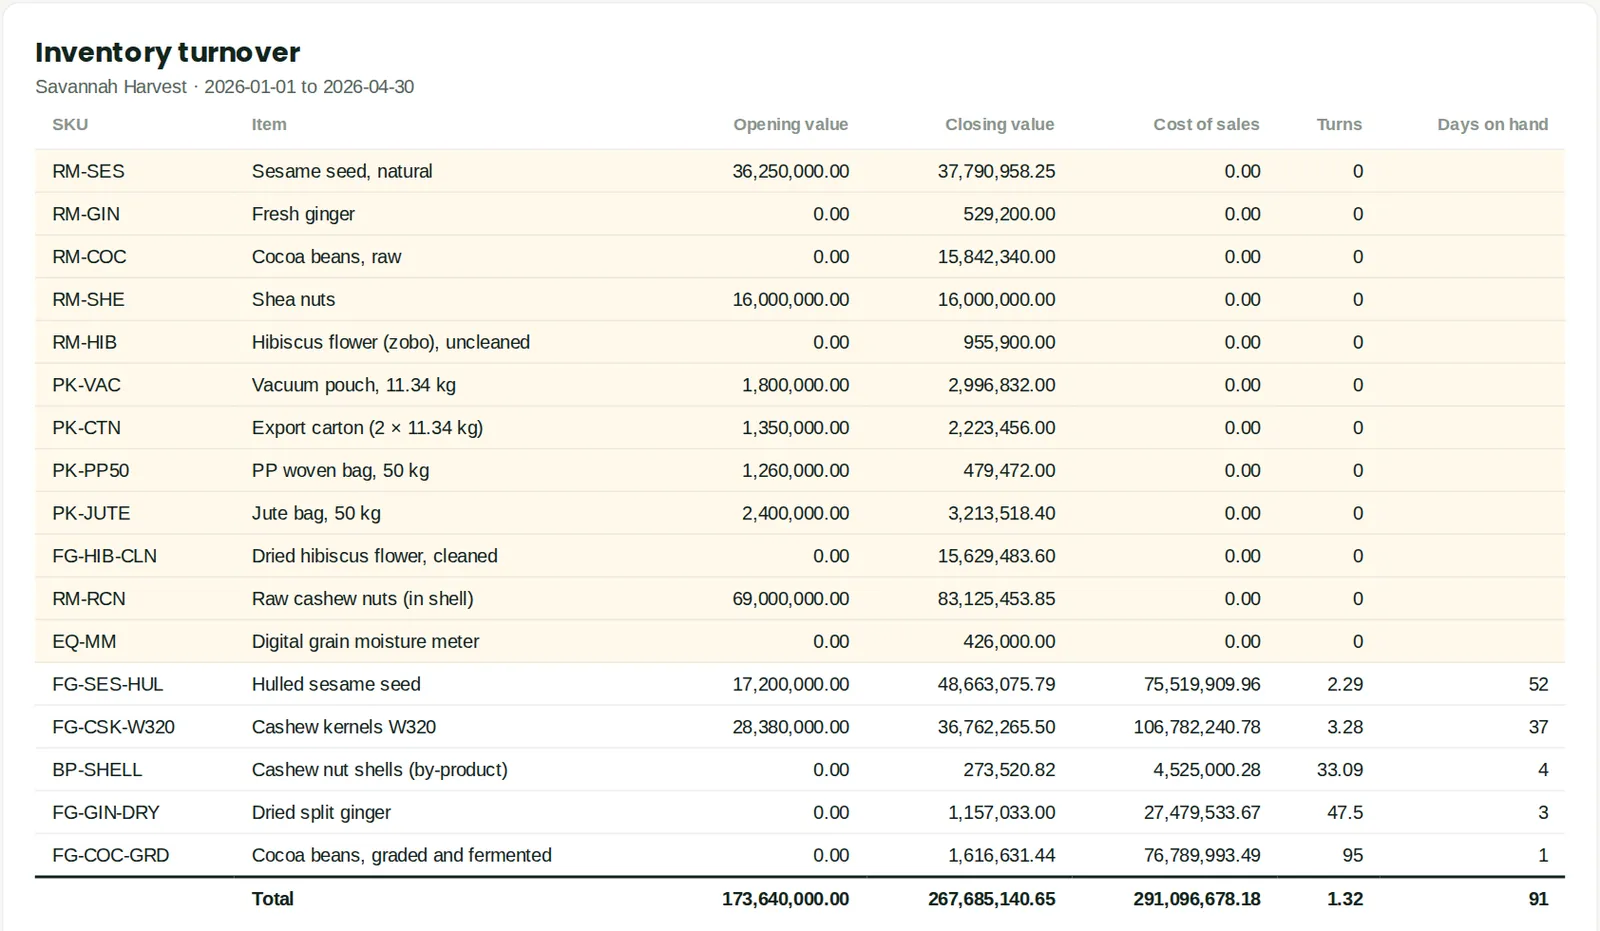
19.46 Inventory turnover
Why
Turns and days on hand per item.
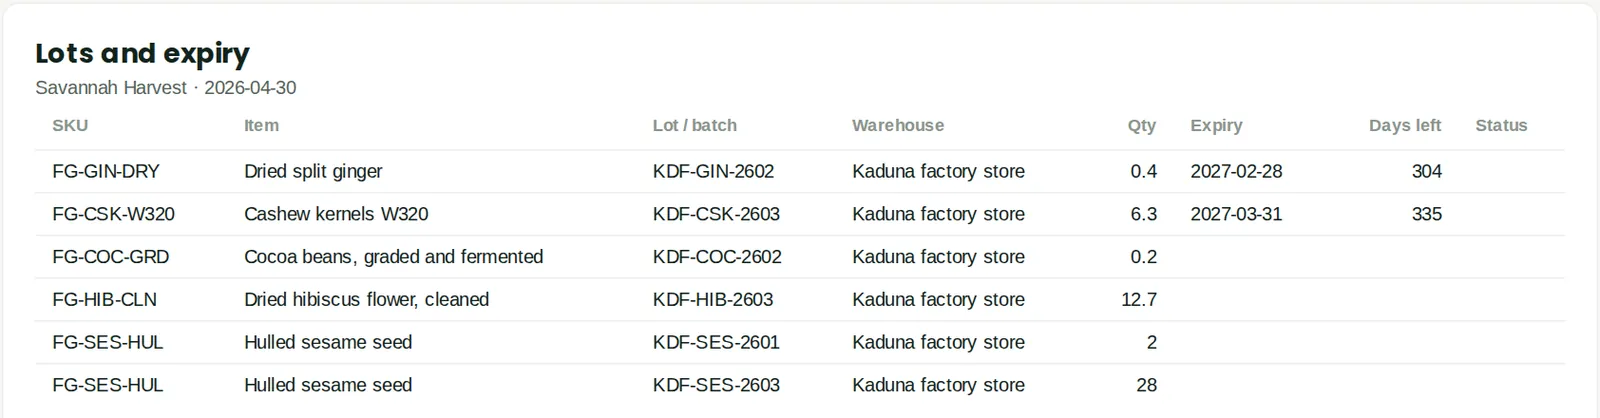
19.47 Lots and expiry
Why
Lot balances with expiry warnings (FEFO).
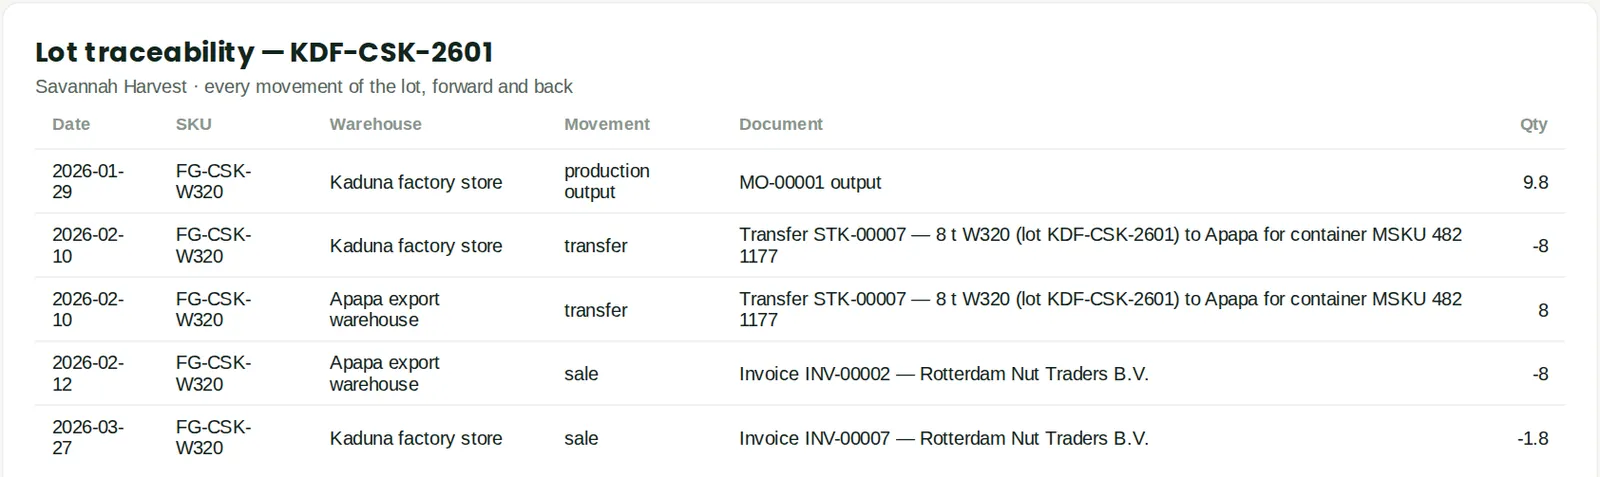
19.48 Lot traceability
Why
Every movement of a lot — for recalls.
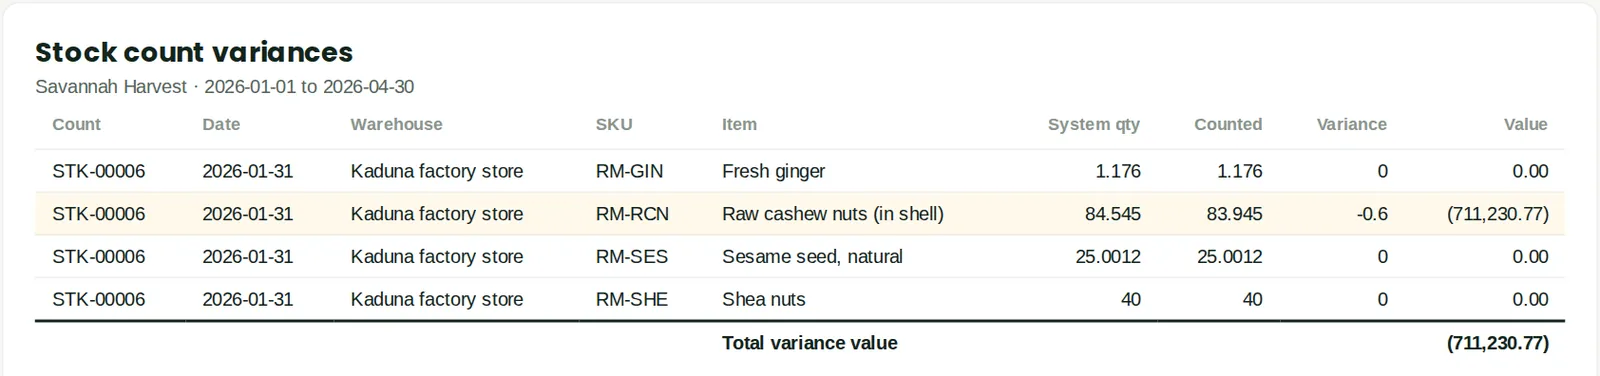
19.49 Stock count variances
Why
Counted vs system quantity and the value adjusted.
19.50 Production order status

Why
Planned, done, scrap, estimated vs actual cost and WIP per order. Empty: no production orders were open at 30 April.
19.51 Work in progress

Why
Cost in WIP by order, reconciled to the WIP account. Empty: no production in progress; the WIP account agrees.
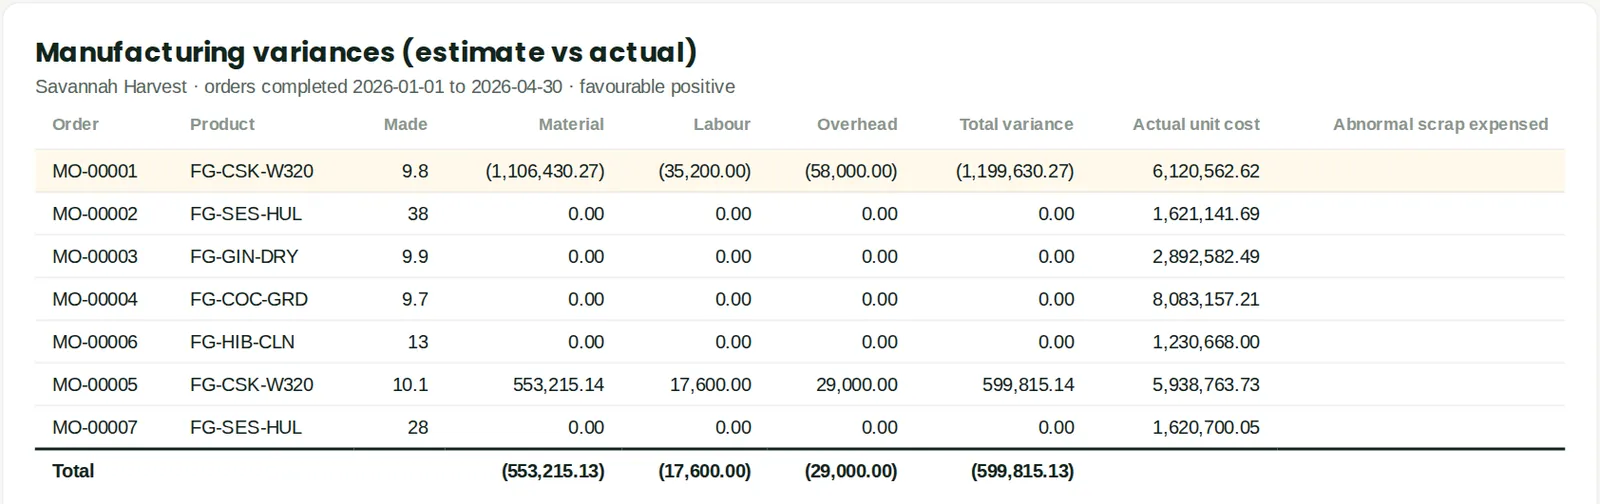
19.52 Manufacturing variances
Why
Material, labour and overhead variances on completed orders.
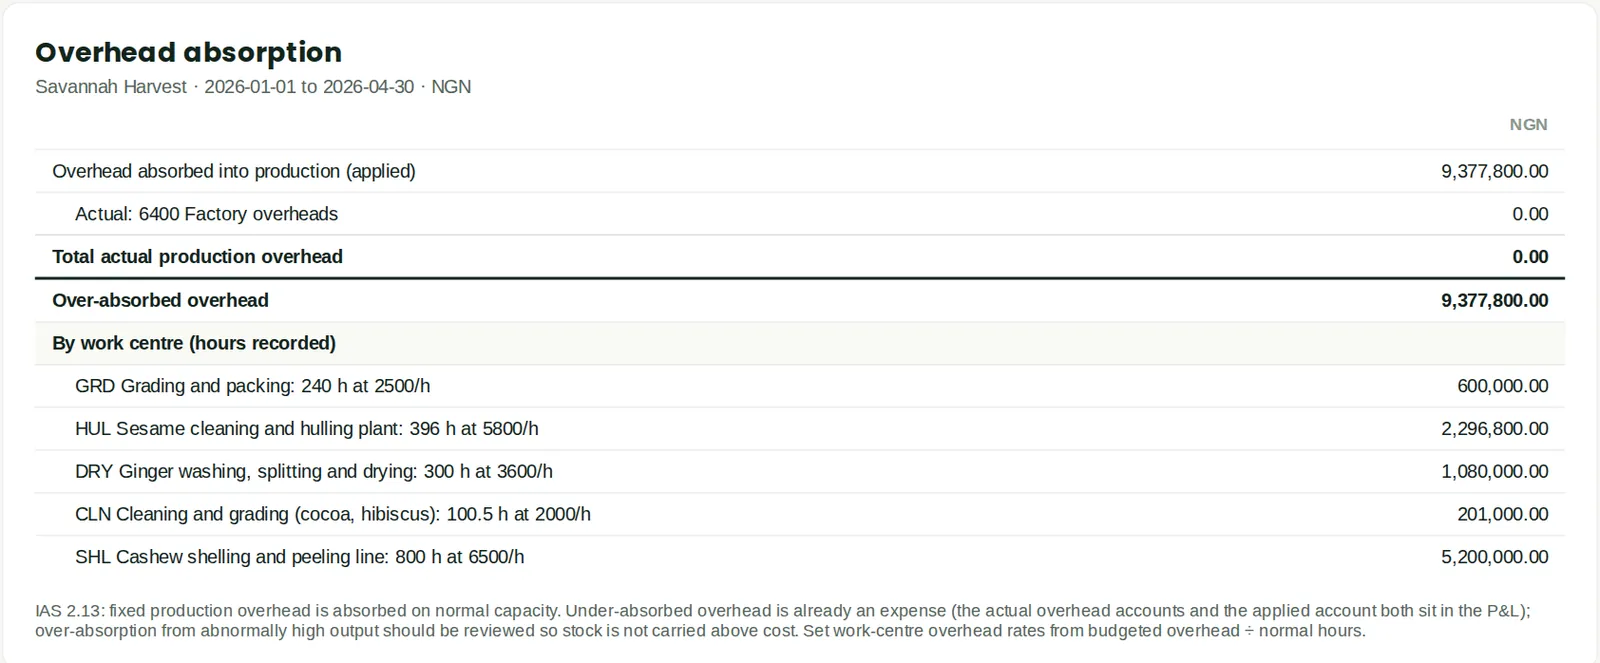
19.53 Labour and overhead absorption
Why
Hours and cost applied by work centre vs the actual cost pools (IAS 2 normal capacity). In the illustration the factory's actual overheads (electricity, diesel, depreciation) were posted to their own expense accounts, not to 6400 Factory overheads, so all absorbed overhead shows as over-absorbed. Post actual production overheads to the factory overheads account for a meaningful comparison.
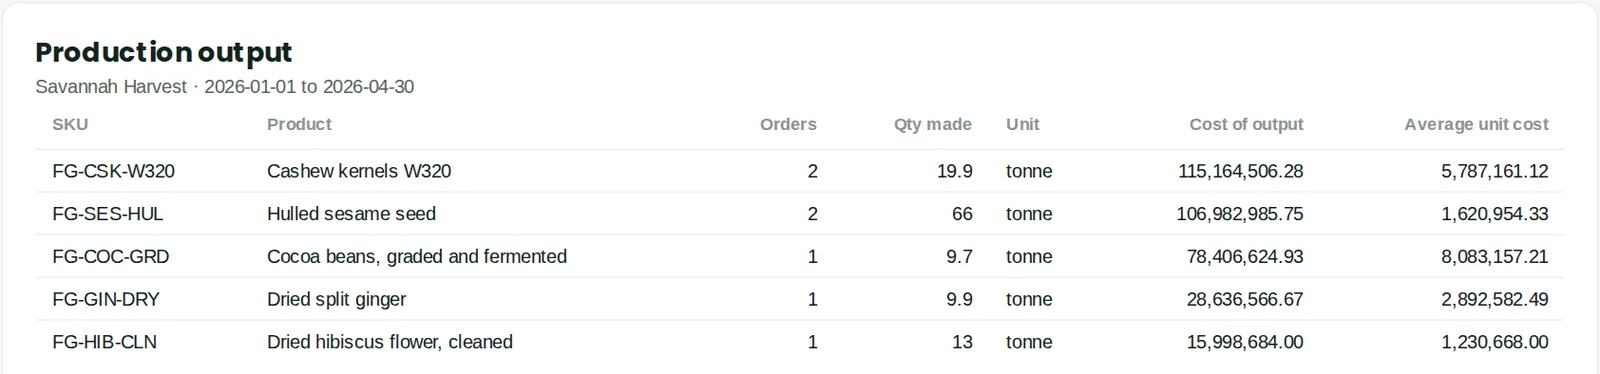
19.54 Production history
Why
Output and unit cost by product.
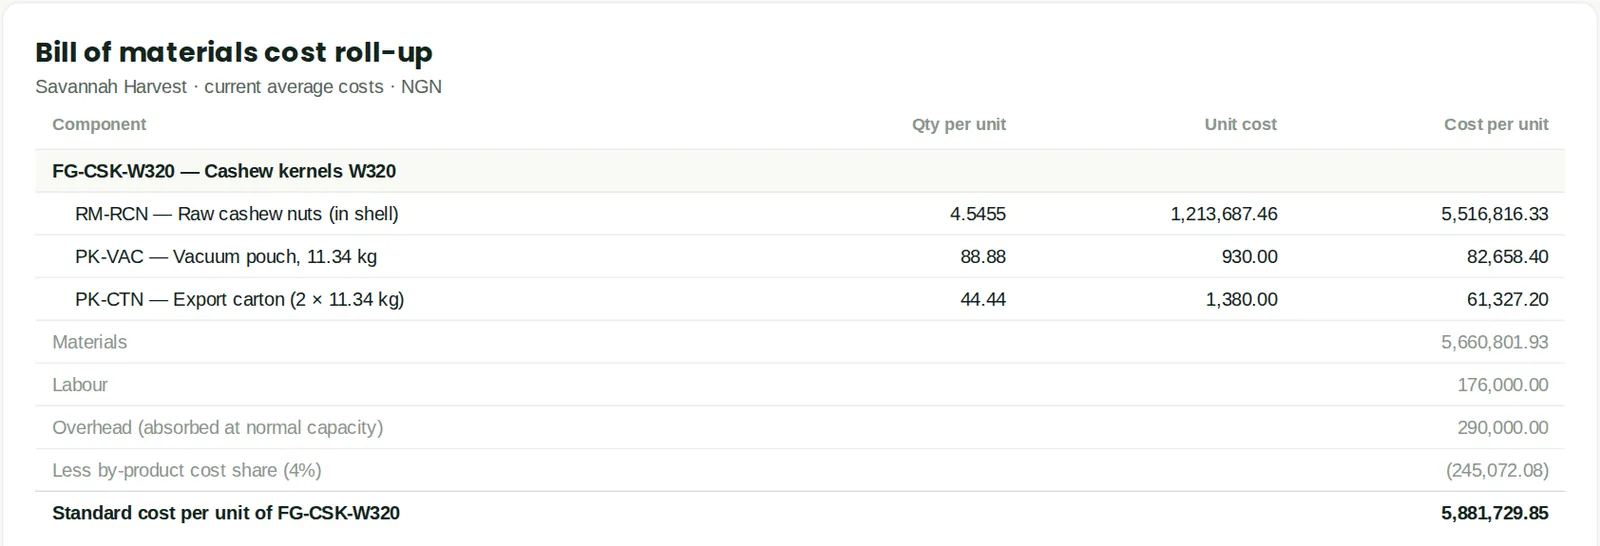
19.55 Bill of materials cost roll-up
Why
Multi-level material, labour and overhead cost of a product.
19.56 Where used

Why
Which bills of materials use a component.
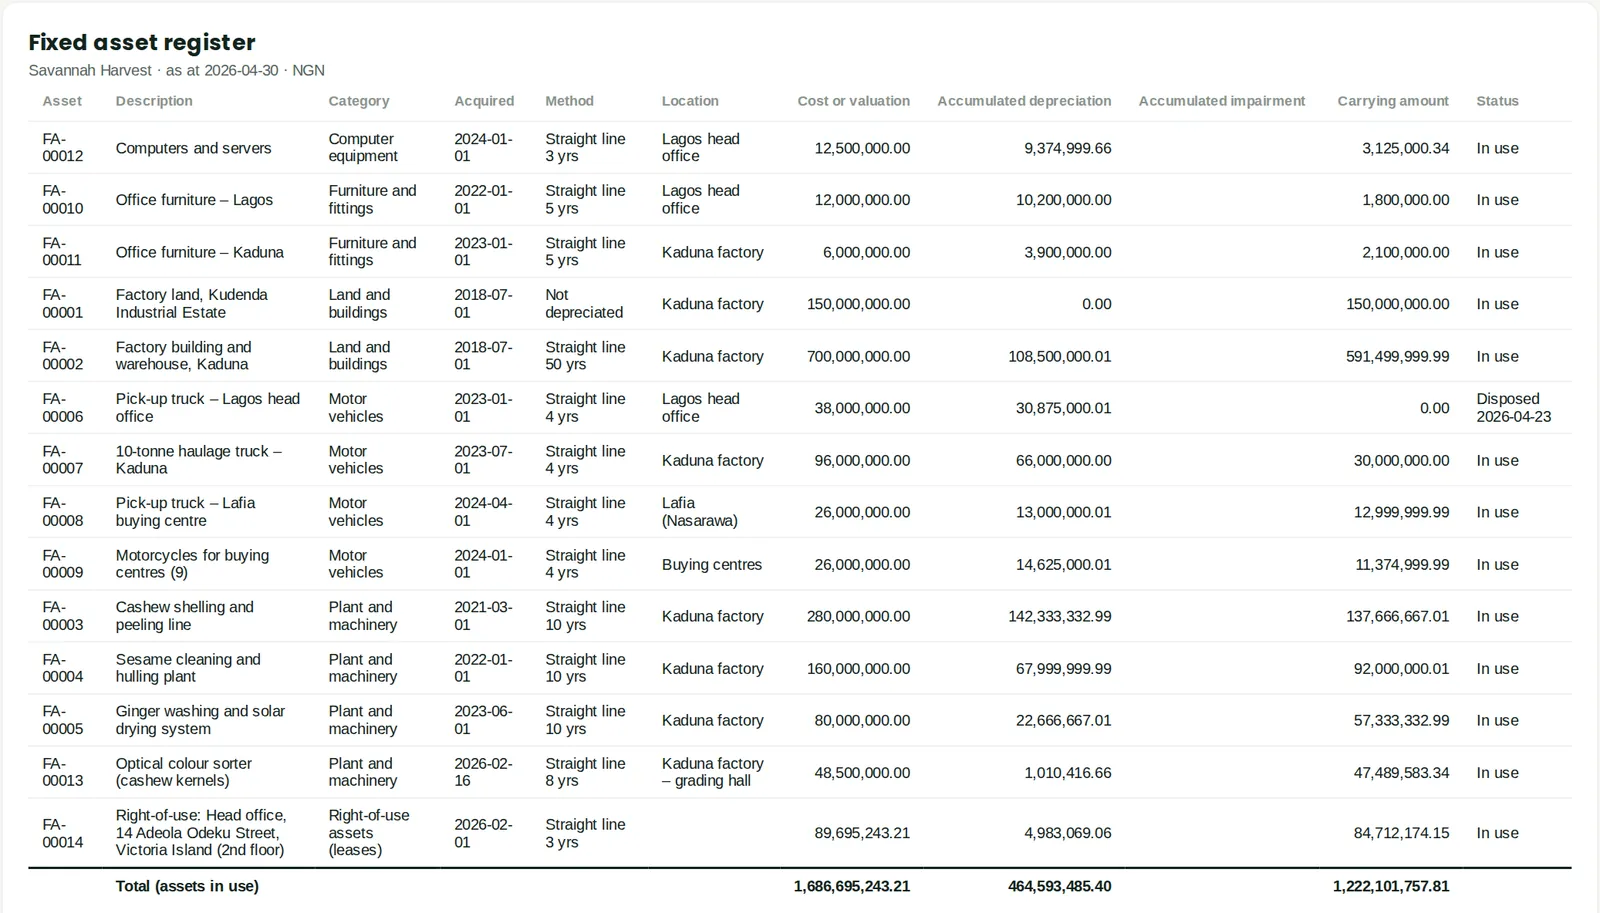
19.57 Fixed asset register
Why
Cost, accumulated depreciation and carrying amount (IAS 16).
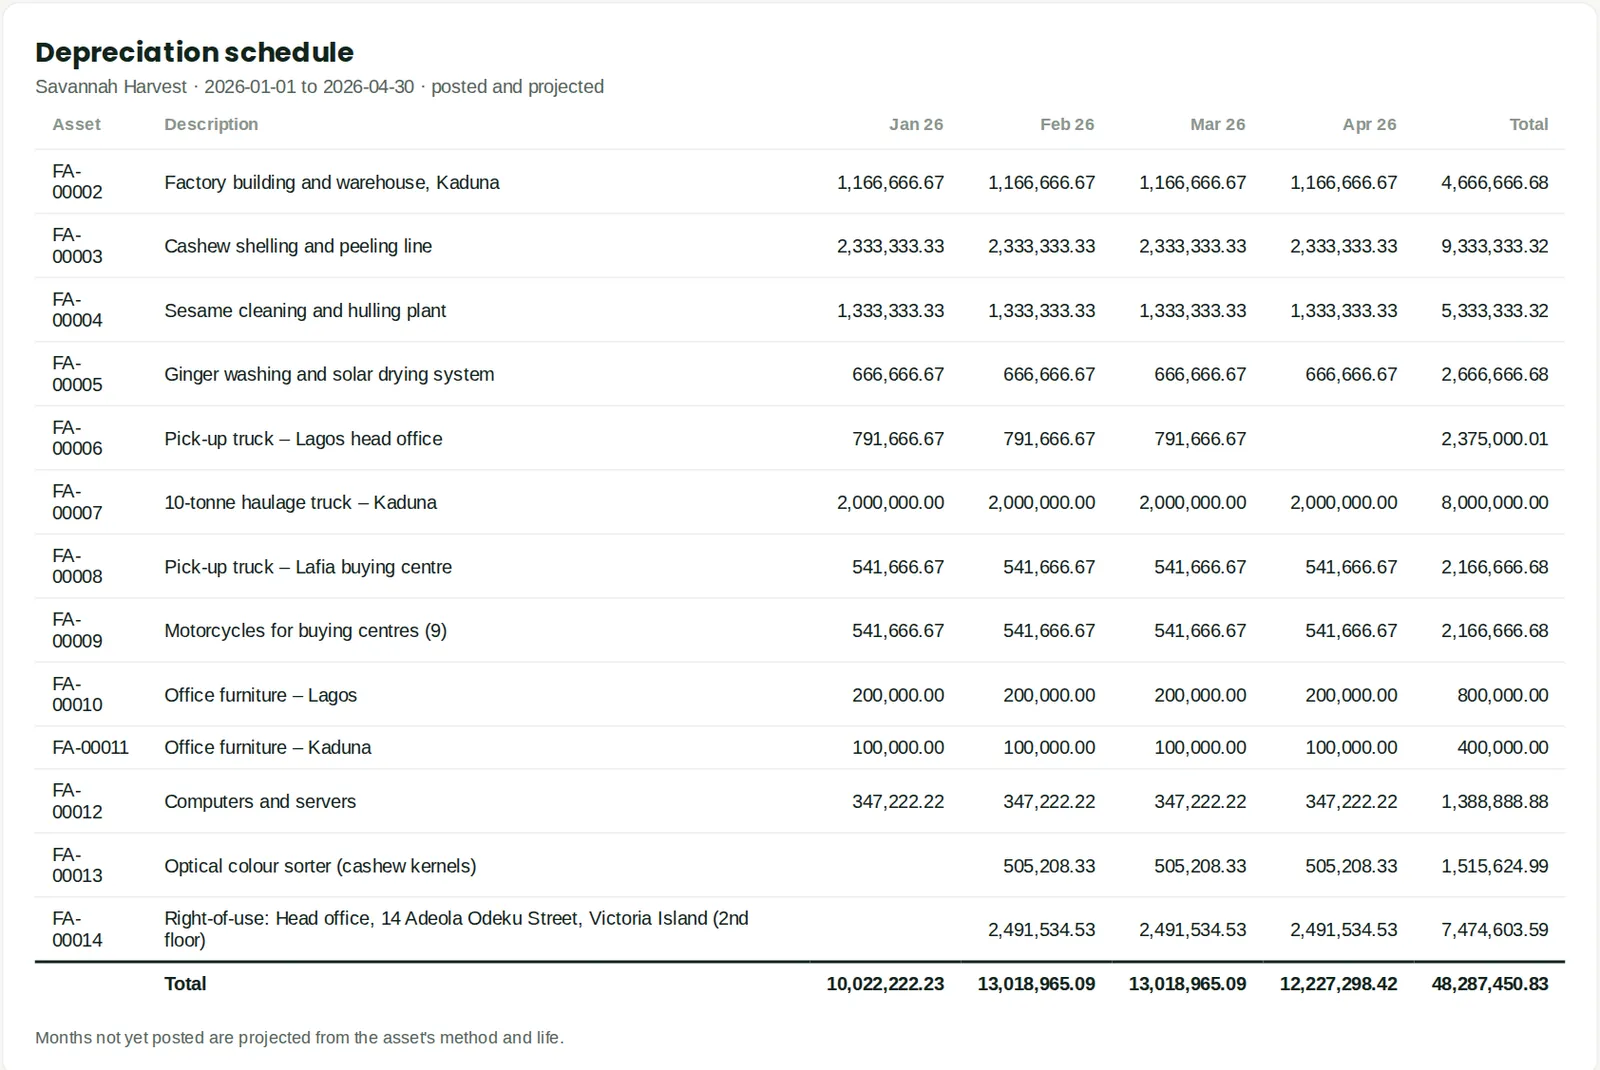
19.58 Depreciation schedule
Why
Charge per asset per month for the period.
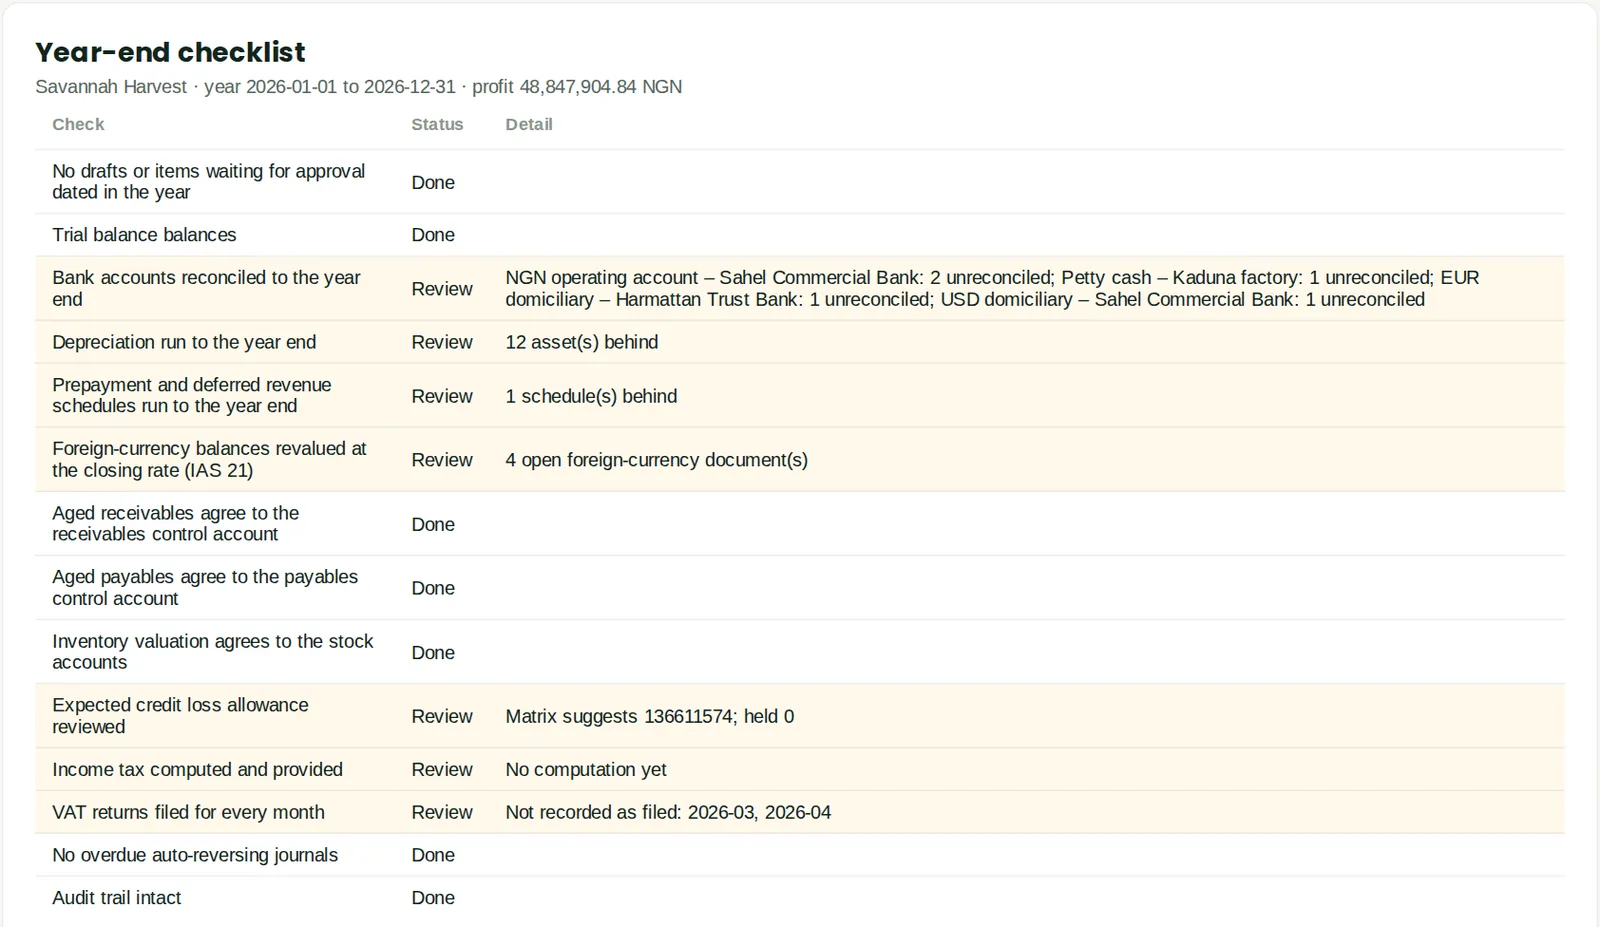
19.59 Year-end checklist
Why
Drafts, reconciliations, depreciation, sub-ledger ties, ECL, tax, VAT returns and audit trail integrity for a financial year.
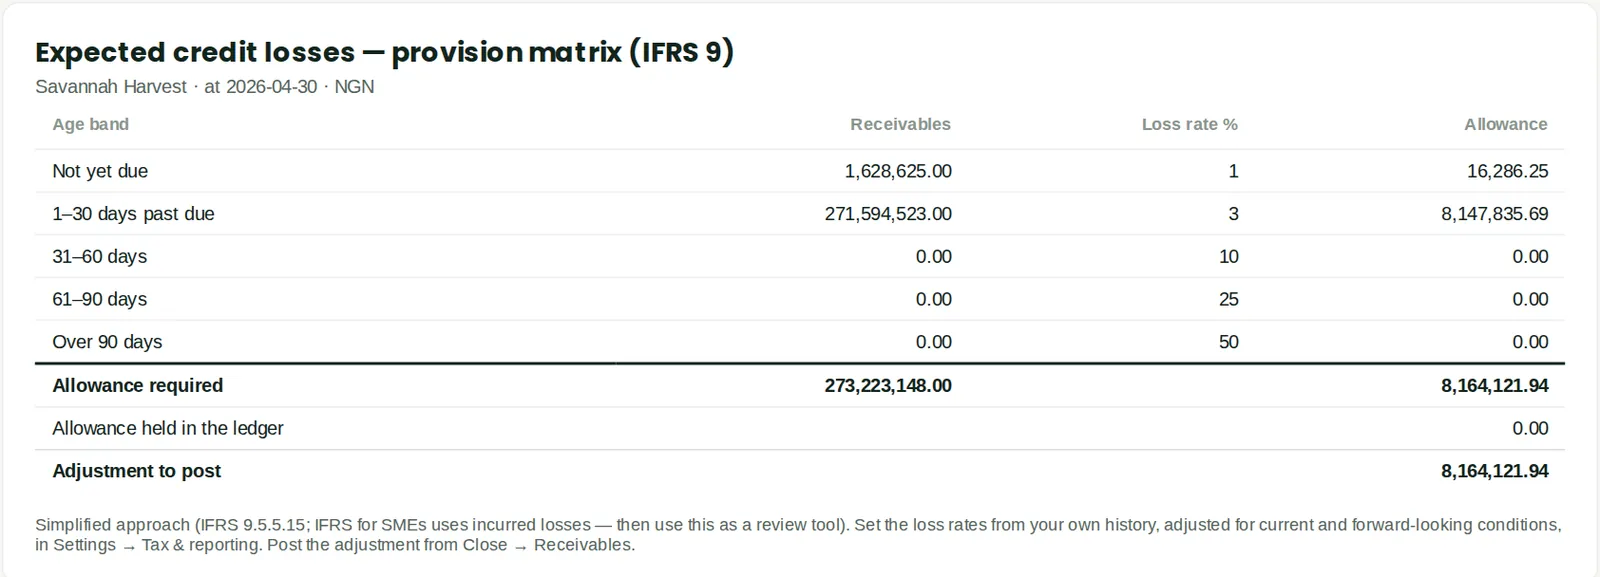
19.60 Expected credit losses (provision matrix)
Why
IFRS 9 simplified approach: aged receivables × loss rates vs the allowance held.
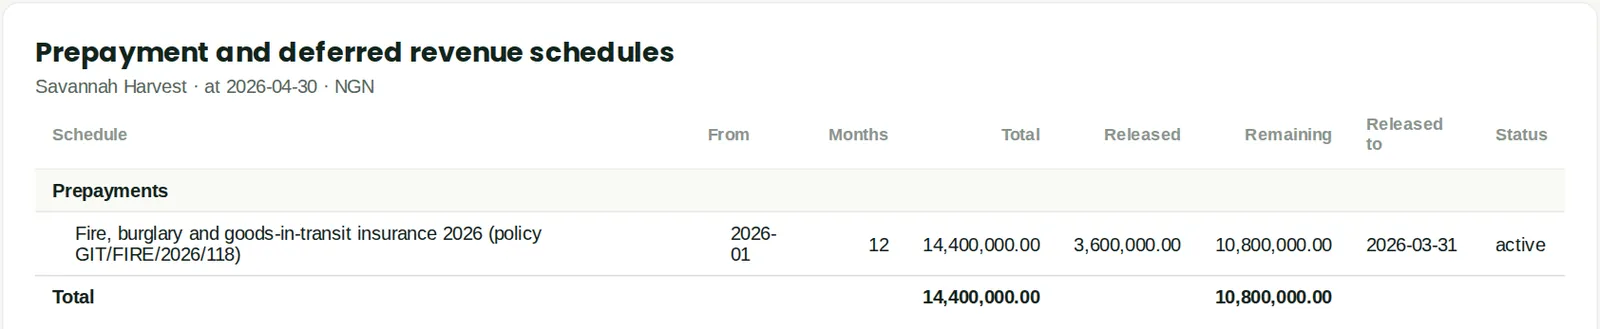
19.61 Prepayment and deferred revenue schedules
Why
Amounts released and remaining on each schedule.
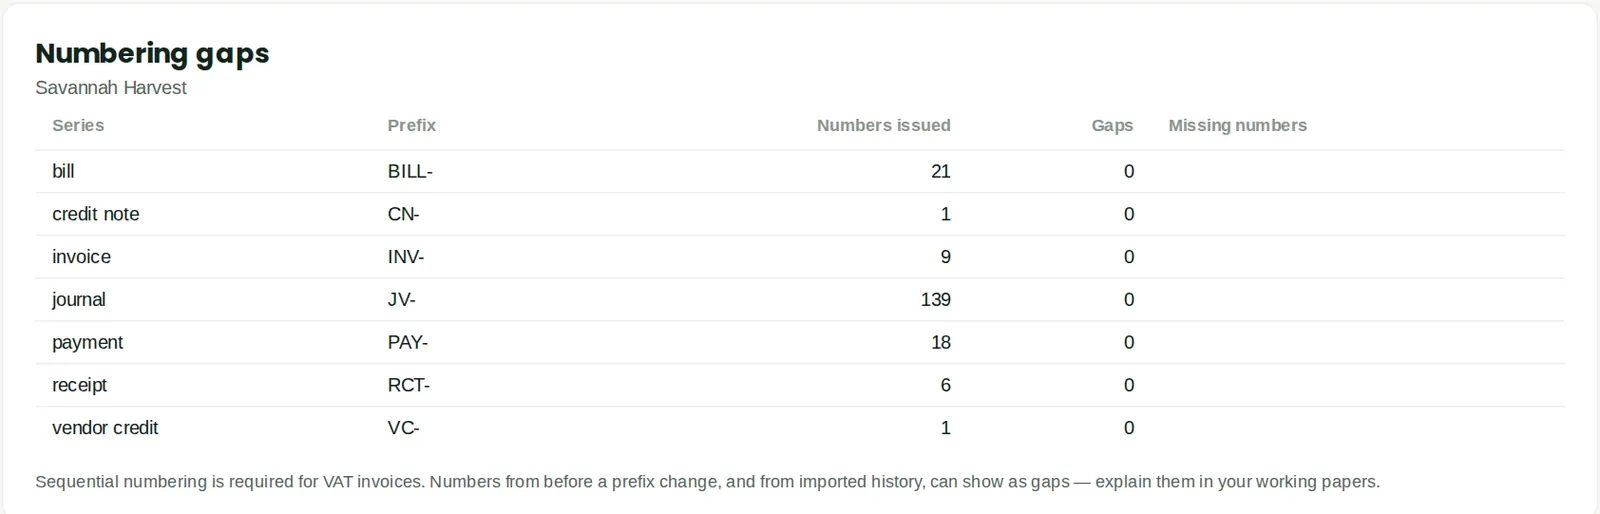
19.62 Numbering gaps
Why
Missing numbers in invoice, credit note, bill, payment and journal series.
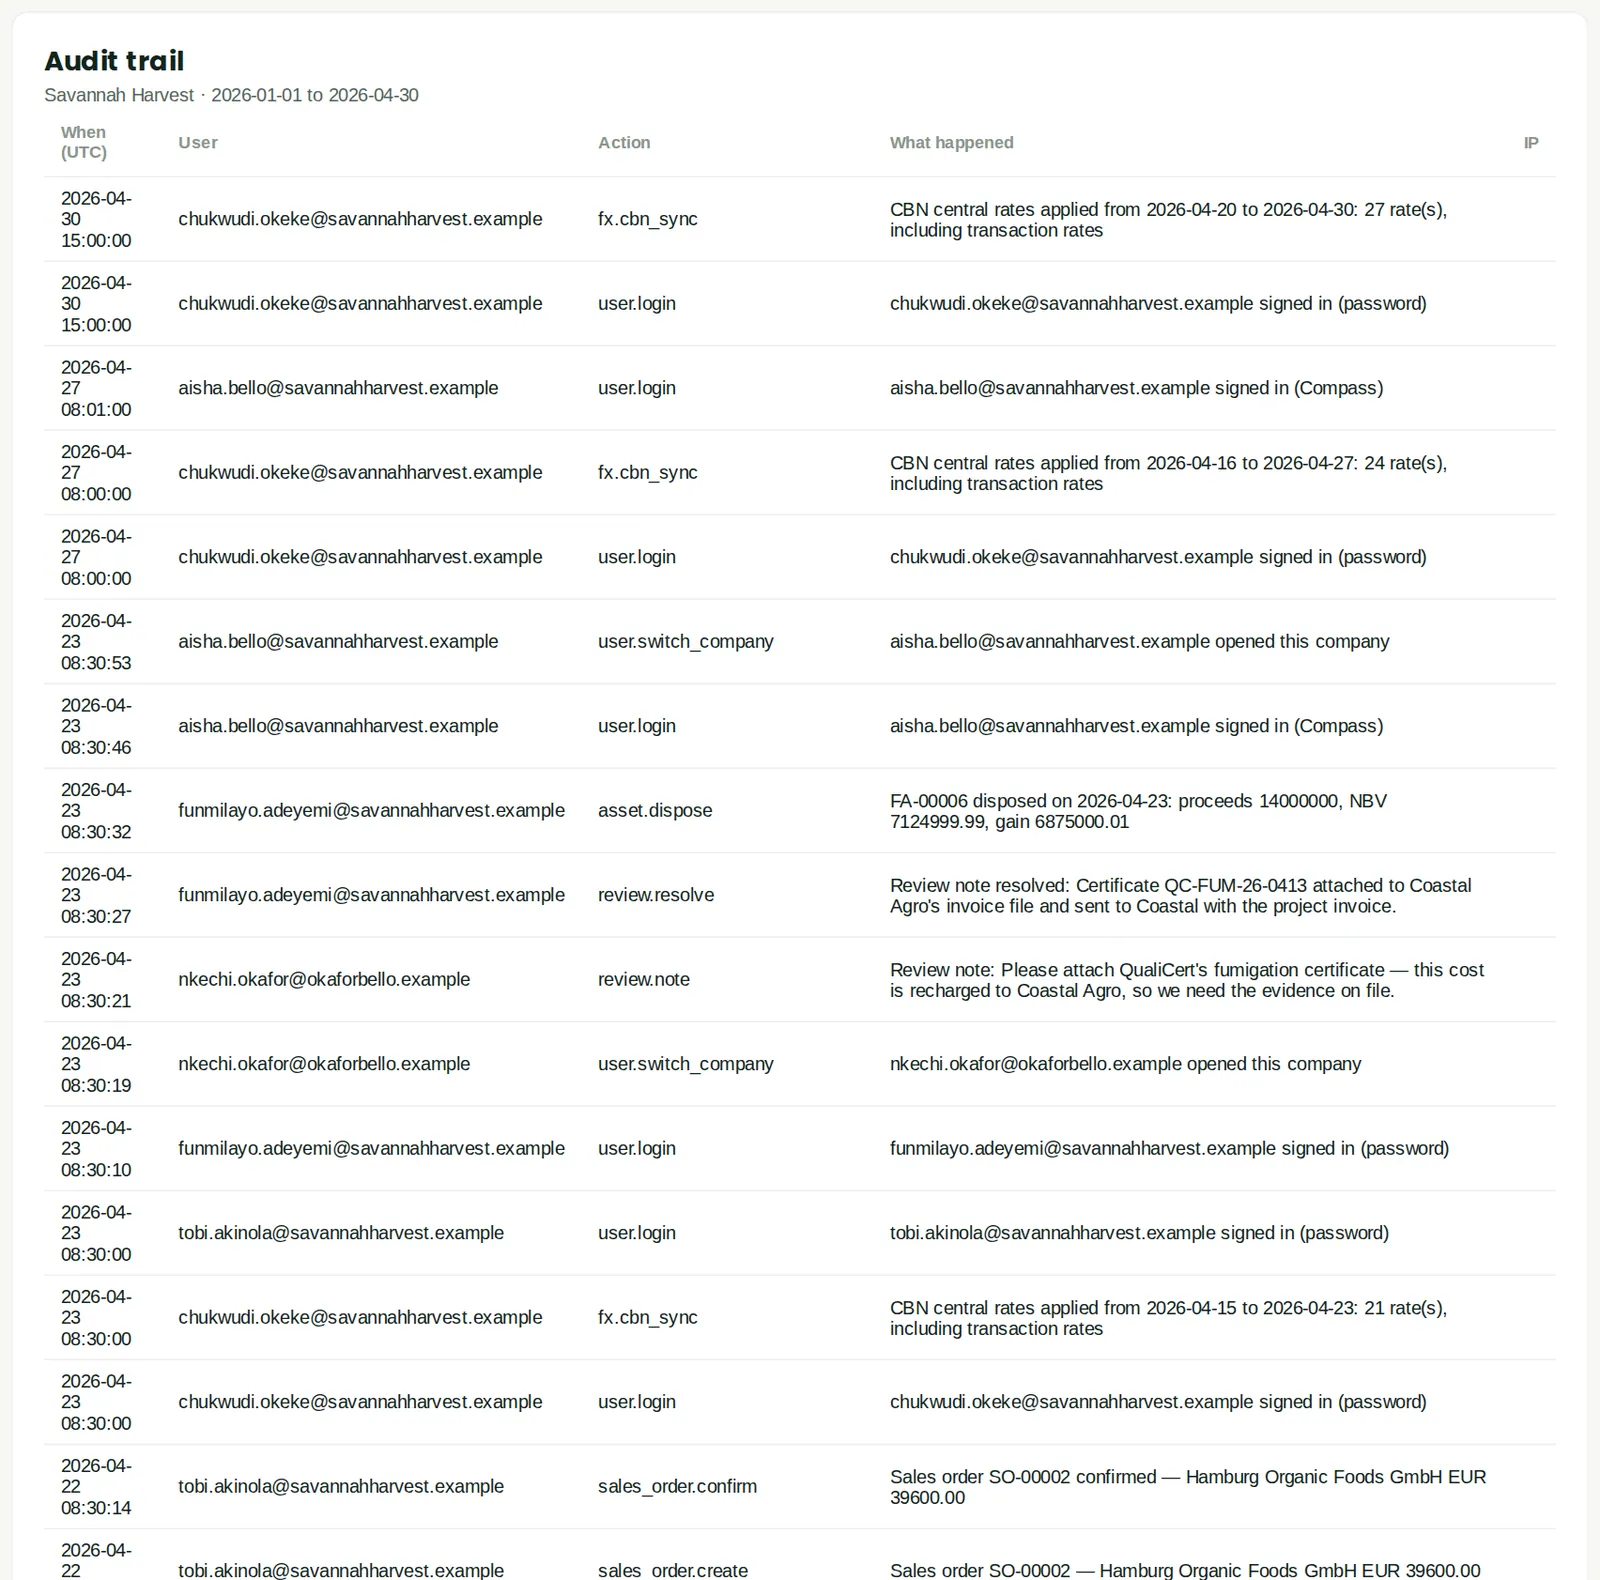
19.63 Audit trail
Why
Who did what and when, with before and after values.
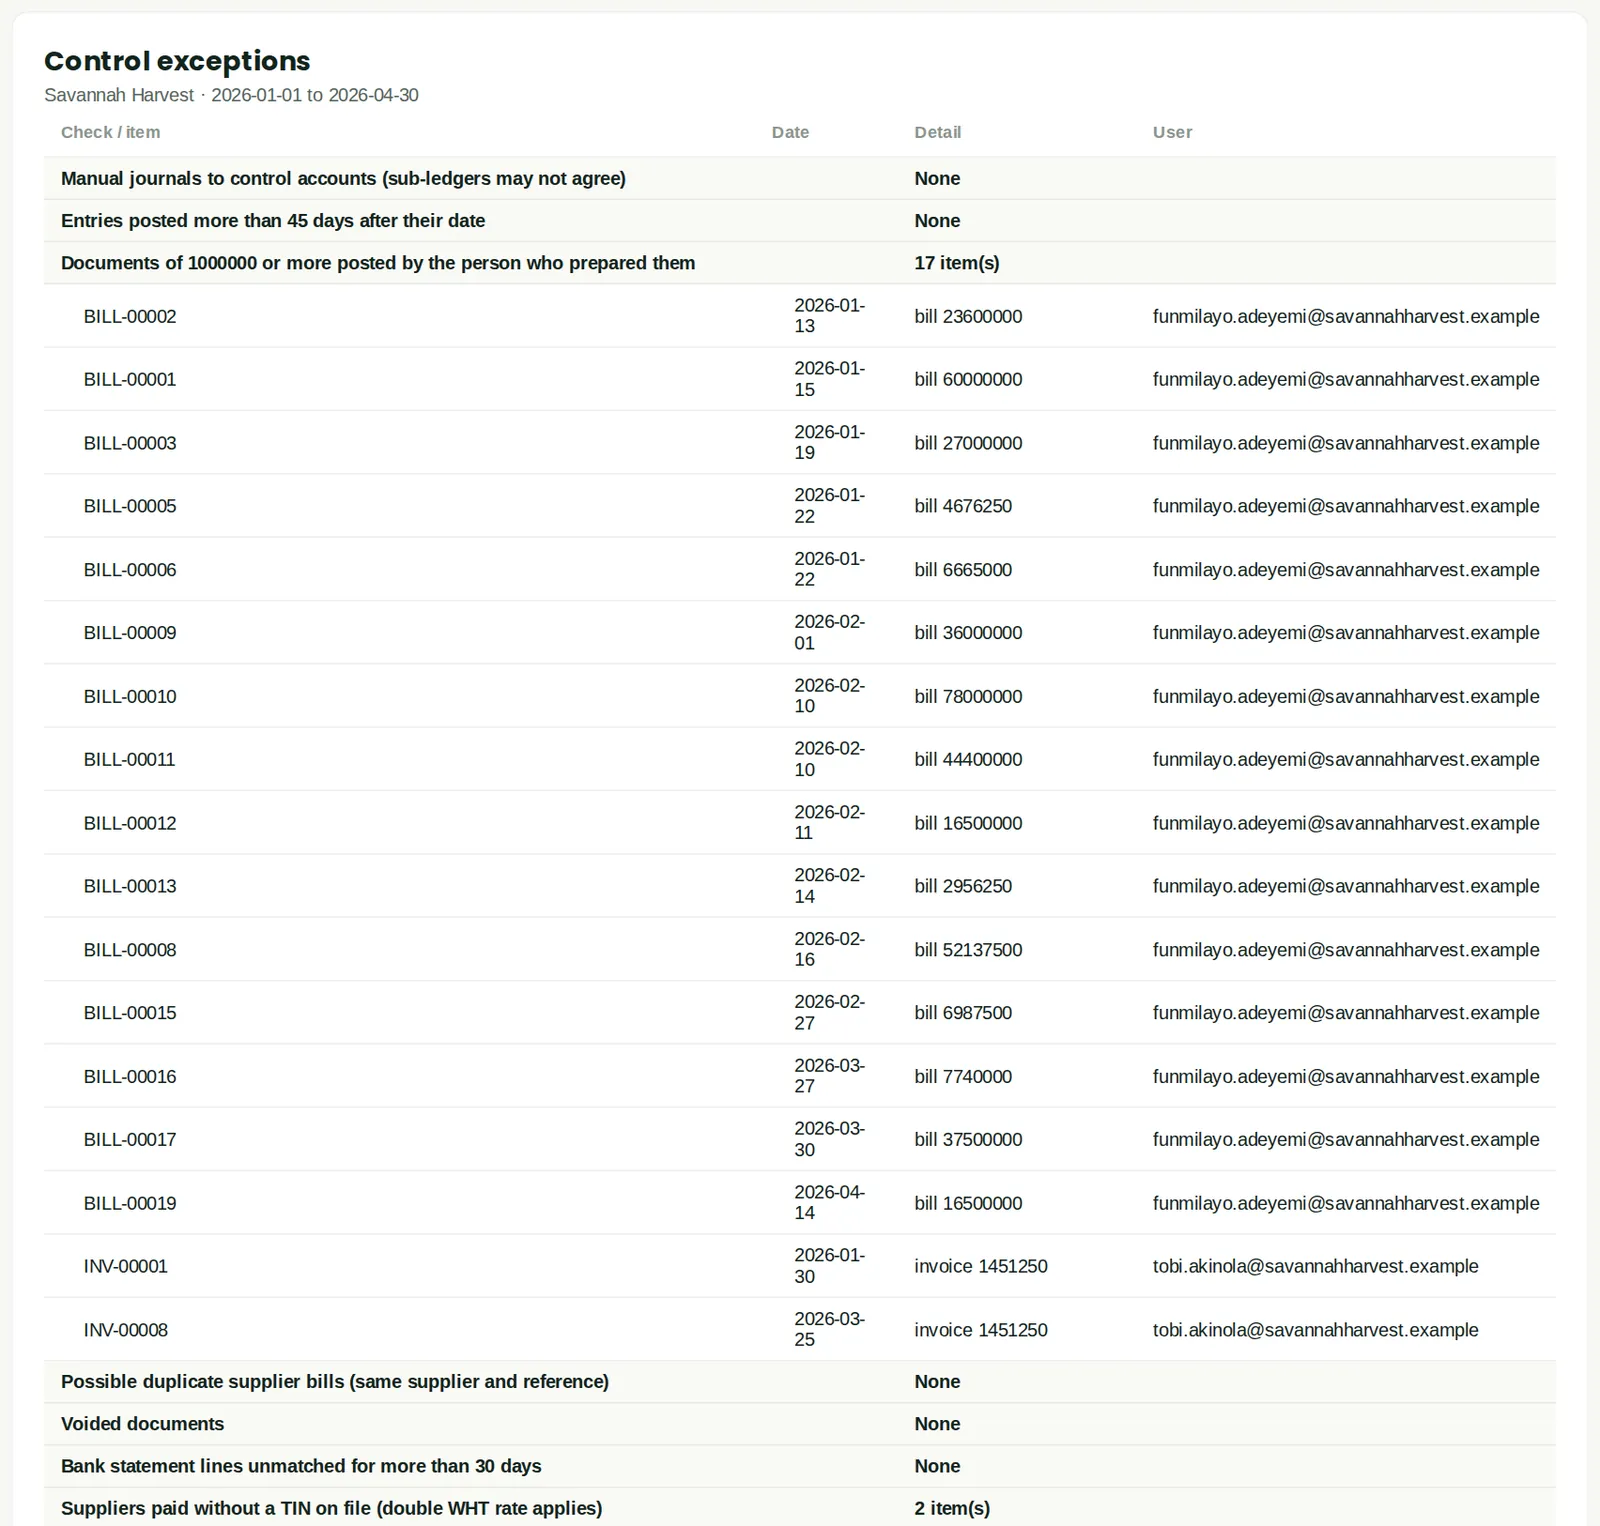
19.64 Control exceptions
Why
Manual journals to control accounts, back-dated postings, self-approval, duplicate bills, stale bank lines, missing TINs, negative stock and people without 2FA.
19.65 User access review
Why
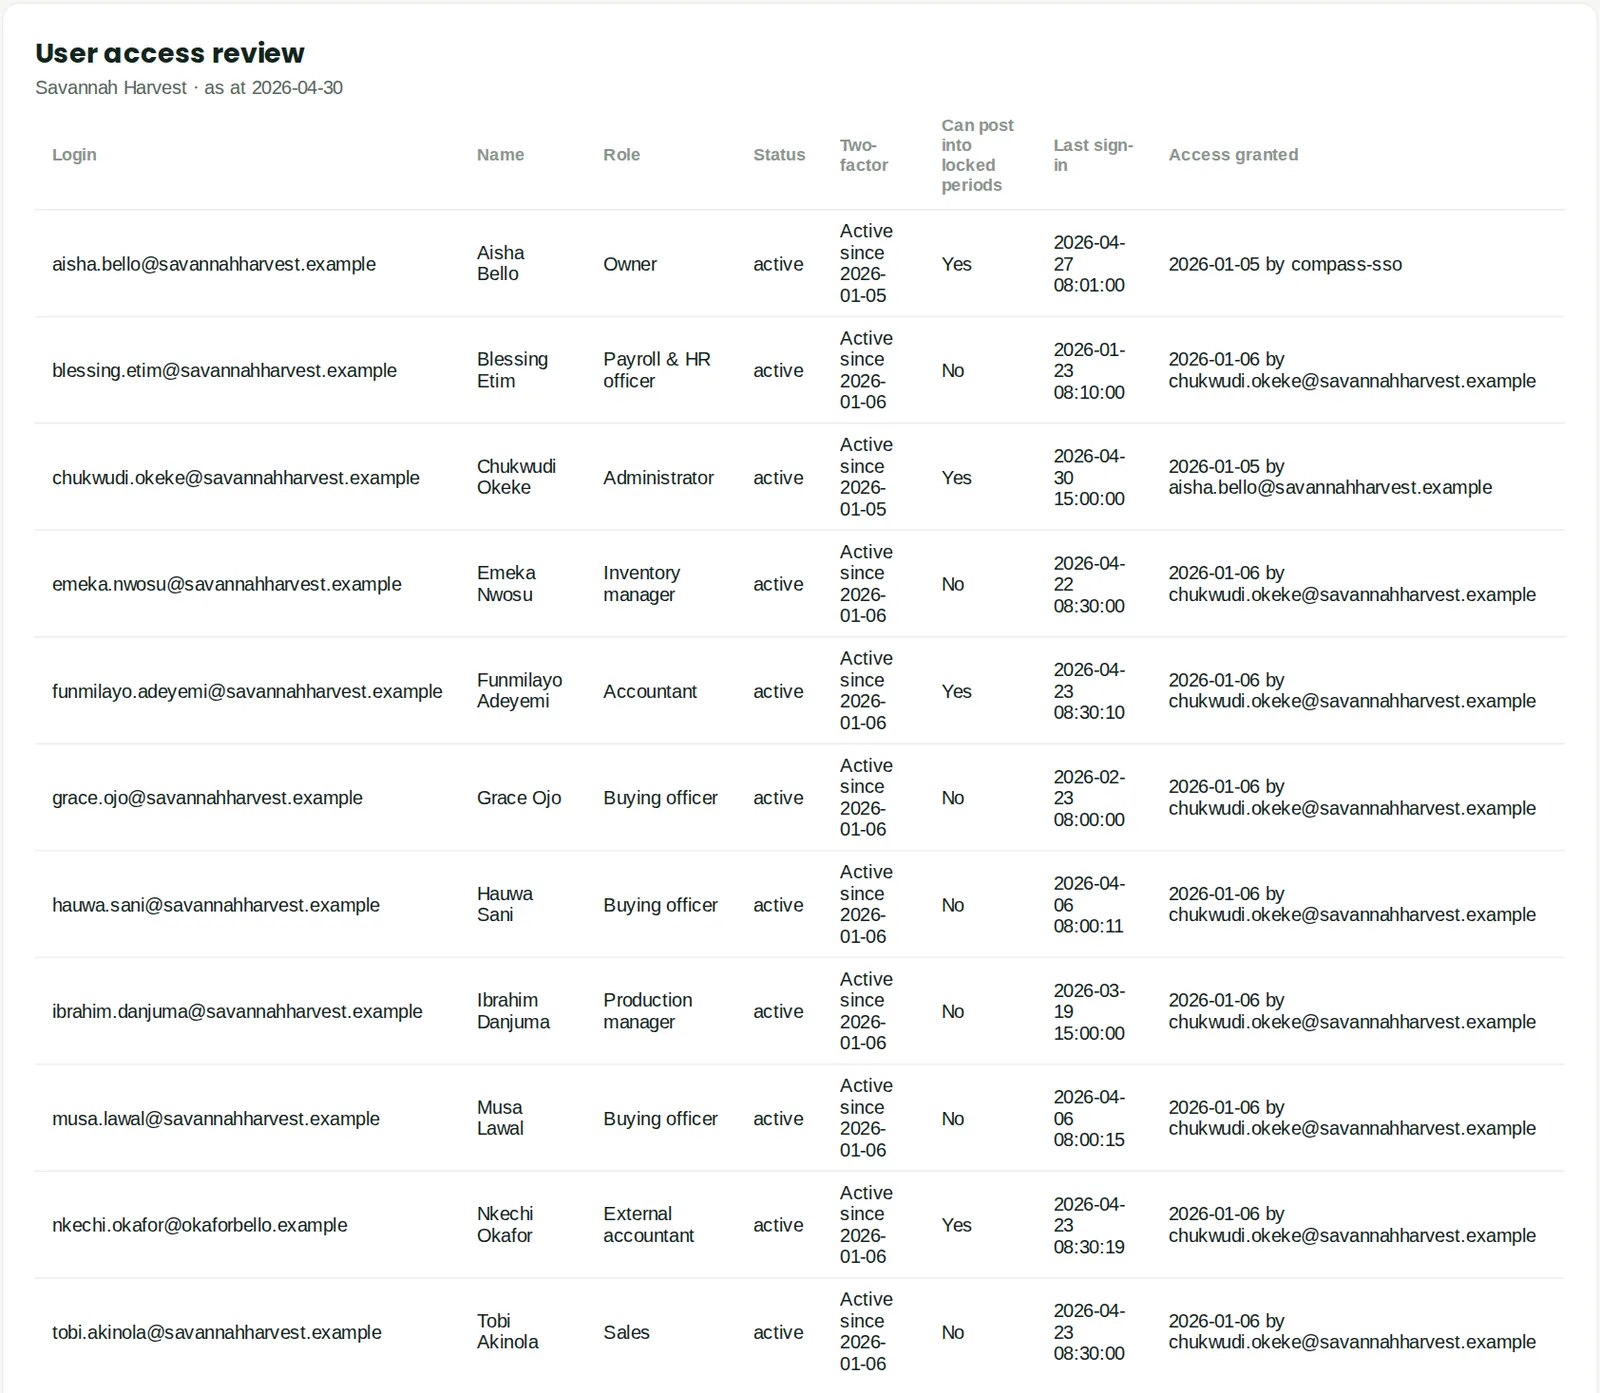
Every person, their role, permissions and 2FA status — for periodic access reviews.
19.66 Chargeable gains (CGT)
Why
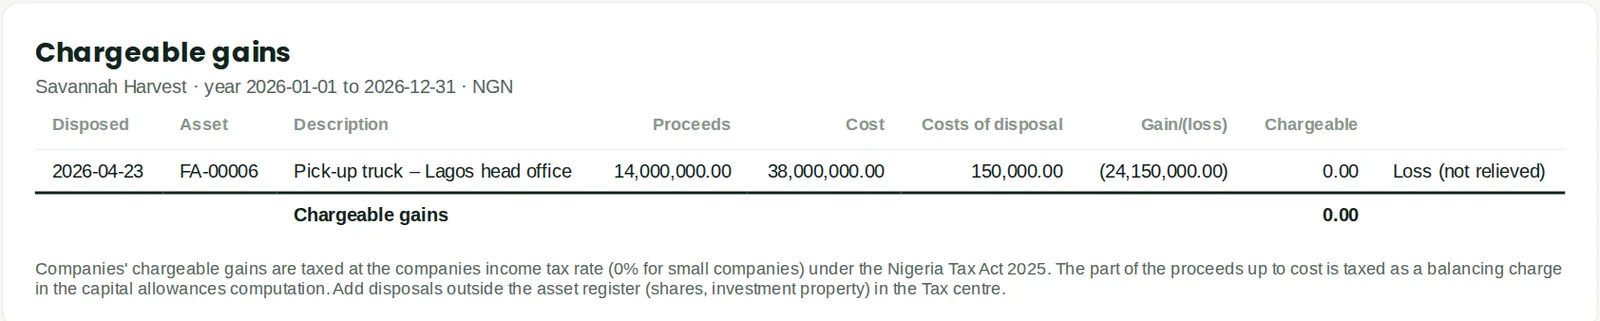
Gains on disposals of chargeable assets for the year, taxed at the companies income tax rate. The Lagos pick-up truck sold in April: proceeds below cost, so no chargeable gain.
19.67 Foreign-currency expenses above the official rate

Why
Section 20(4) add-back: the part of foreign-currency expenses booked above the CBN official rate. Nothing to add back: all foreign-currency expenses were booked at the CBN rate.
19.68 Project profitability
Why
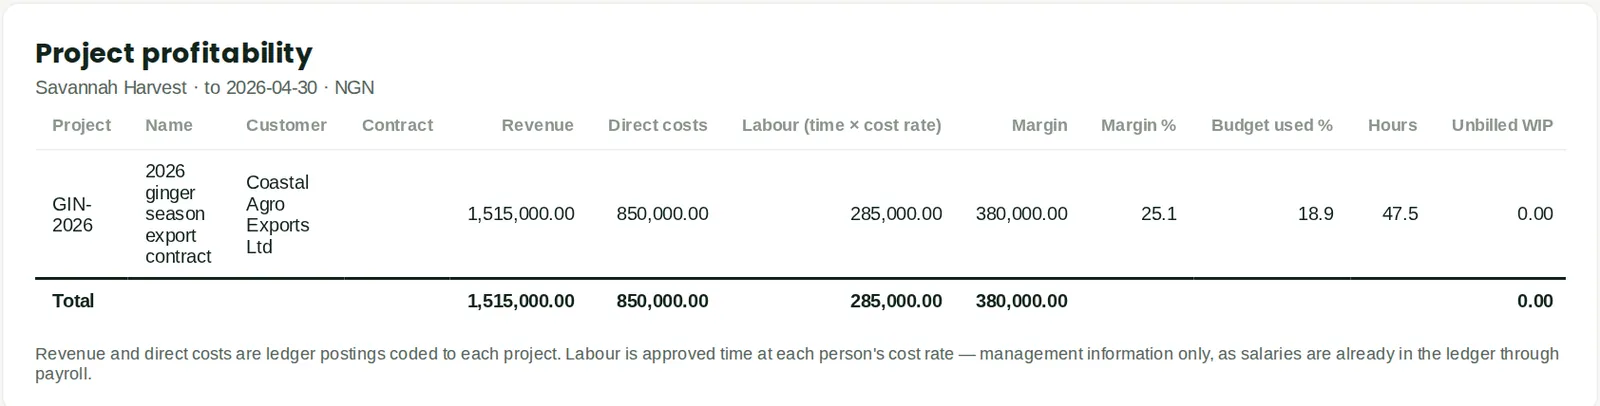
Budget, revenue, costs, margin and unbilled time and expenses per project.
19.69 Project work in progress (unbilled)

Why
Approved billable time and re-chargeable costs not yet invoiced, by project. Empty after the project was billed on 17 April.
19.70 Time by person and project

Why
Hours, billable share (utilisation), billed and waiting for approval.
19.71 Backorders

Why
Sales order lines that cannot be filled from available stock, with the purchase orders due in.
19.72 Stock reservations

Why
Stock held for open sales orders.
19.73 Serial number trace

Why
Where each serial number came from and went, with warranty dates.
19.74 Three-way match status

Why
Bills against their purchase order and goods received, with quantity and price exceptions. Empty: no bills are on hold at 30 April.
19.75 Purchase requisitions
Why
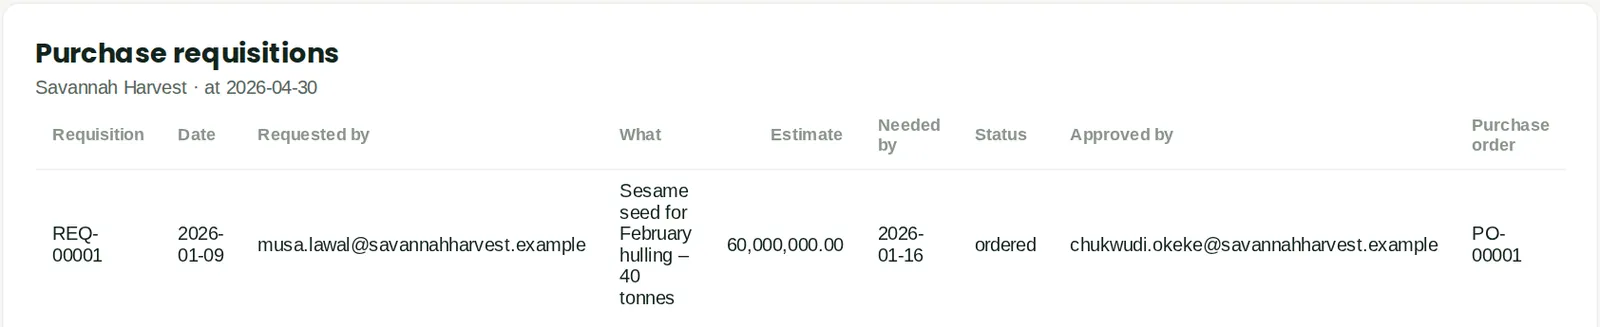
Open requisitions, approvals and the orders raised from them.
19.76 Book health check
Why
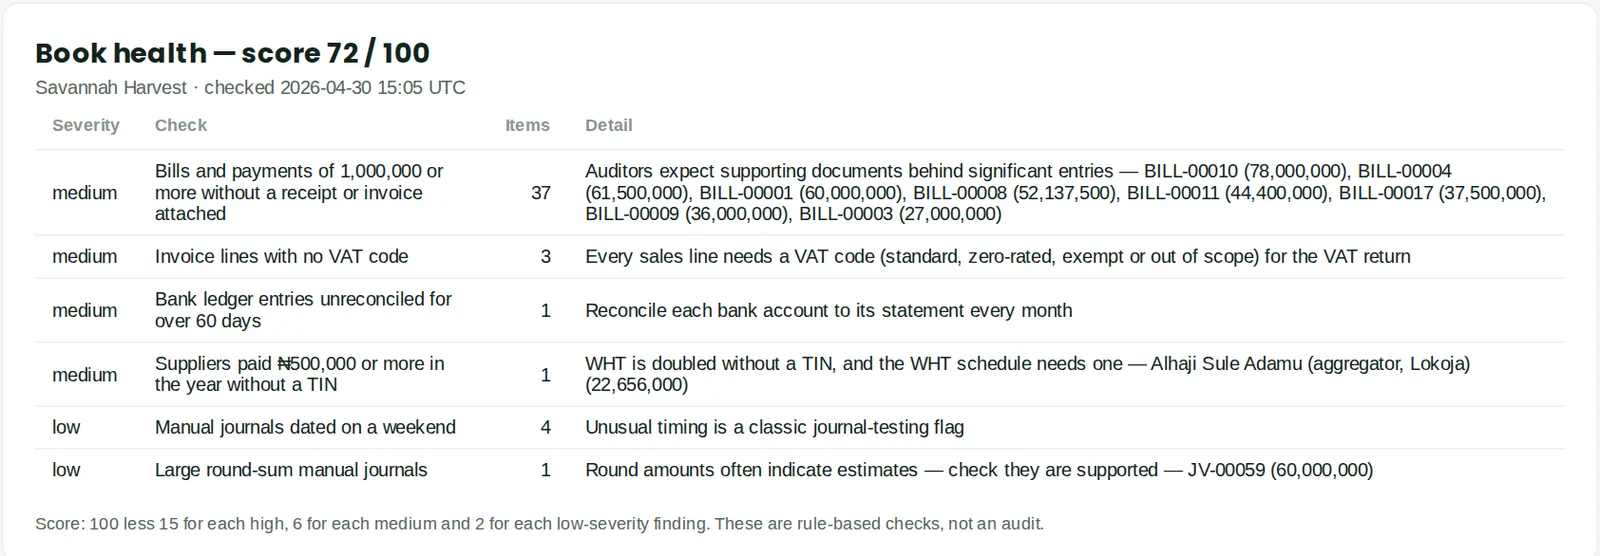
Score and list of issues to clear: suspense balances, unreconciled bank lines, sub-ledger ties, drafts, missing TINs and attachments. The same checks as the Book health tab (chapter 10), as a report.
19.77 Month-end close status

Why
Checklist progress, who closed each month and whether it was locked.
19.78 13-week cash-flow forecast
Why
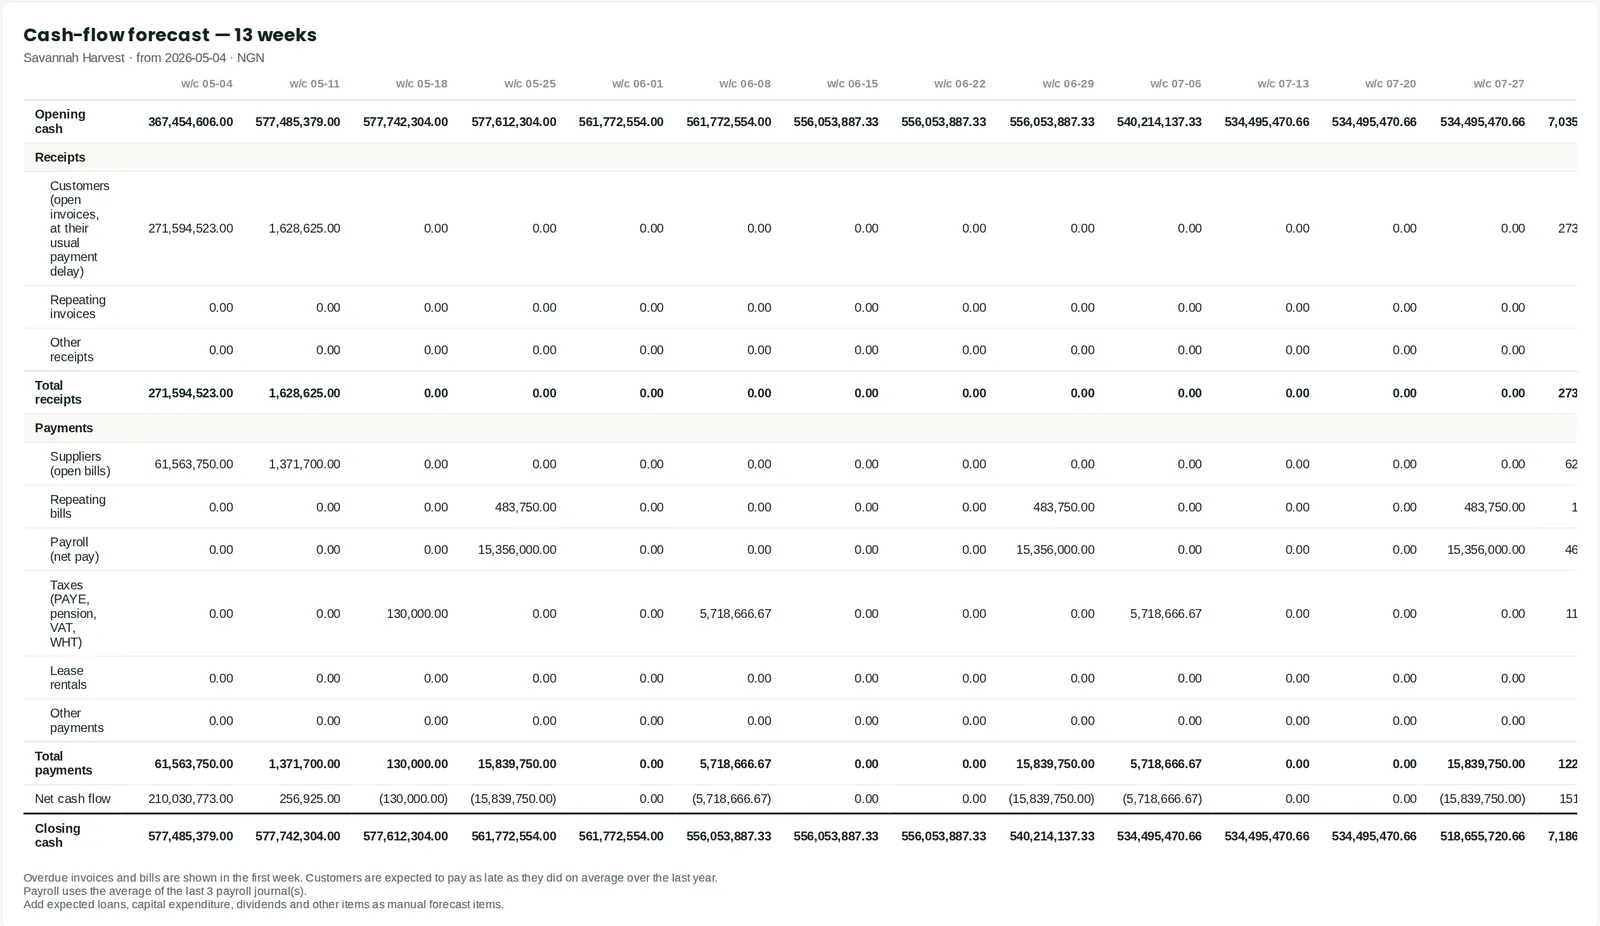
Open invoices at each customer's usual payment delay, bills, repeating transactions, payroll, taxes, lease rentals and manual items.
19.79 Budget versions and scenarios
Why
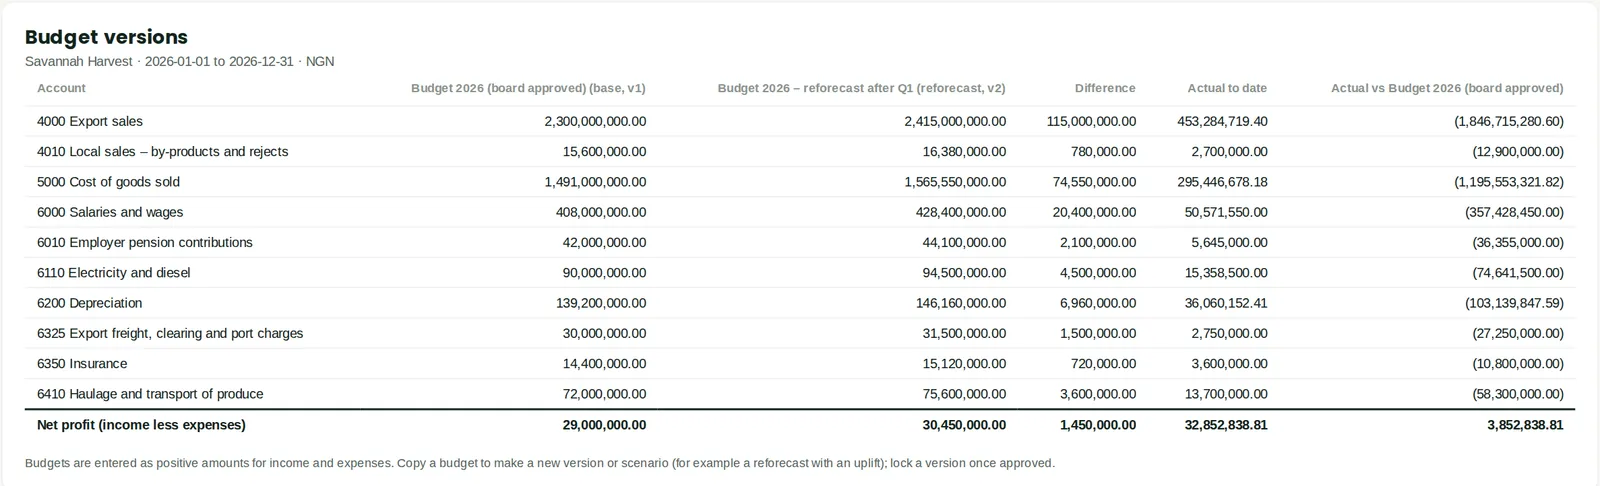
Two budget versions or scenarios side by side, with actuals to date. The approved budget against the reforecast made after the first quarter.
19.80 Lease register (IFRS 16)
Why
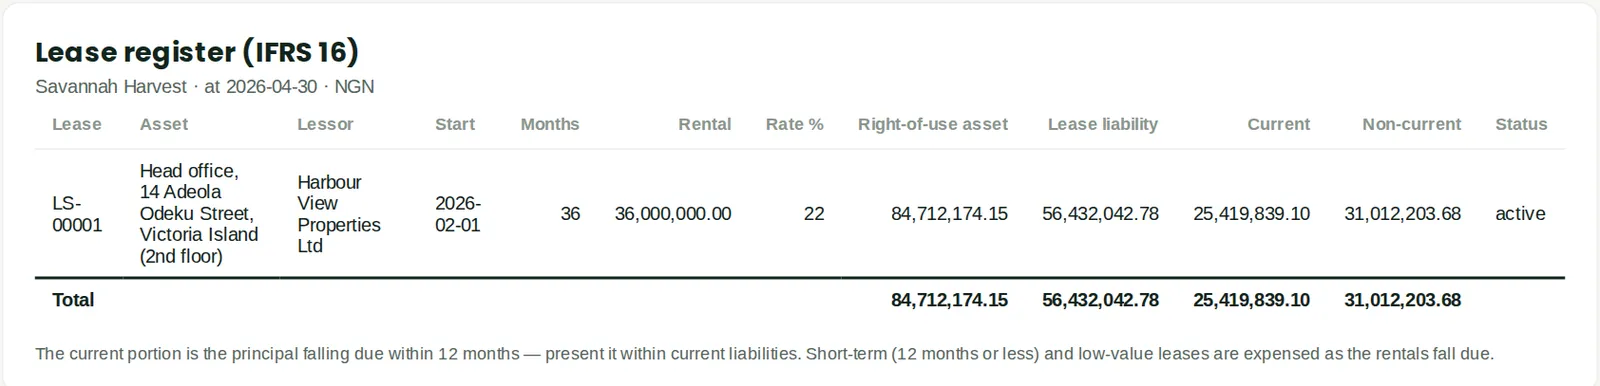
Right-of-use assets, lease liabilities split current and non-current, interest and depreciation.
19.81 Lease liability maturity analysis
Why
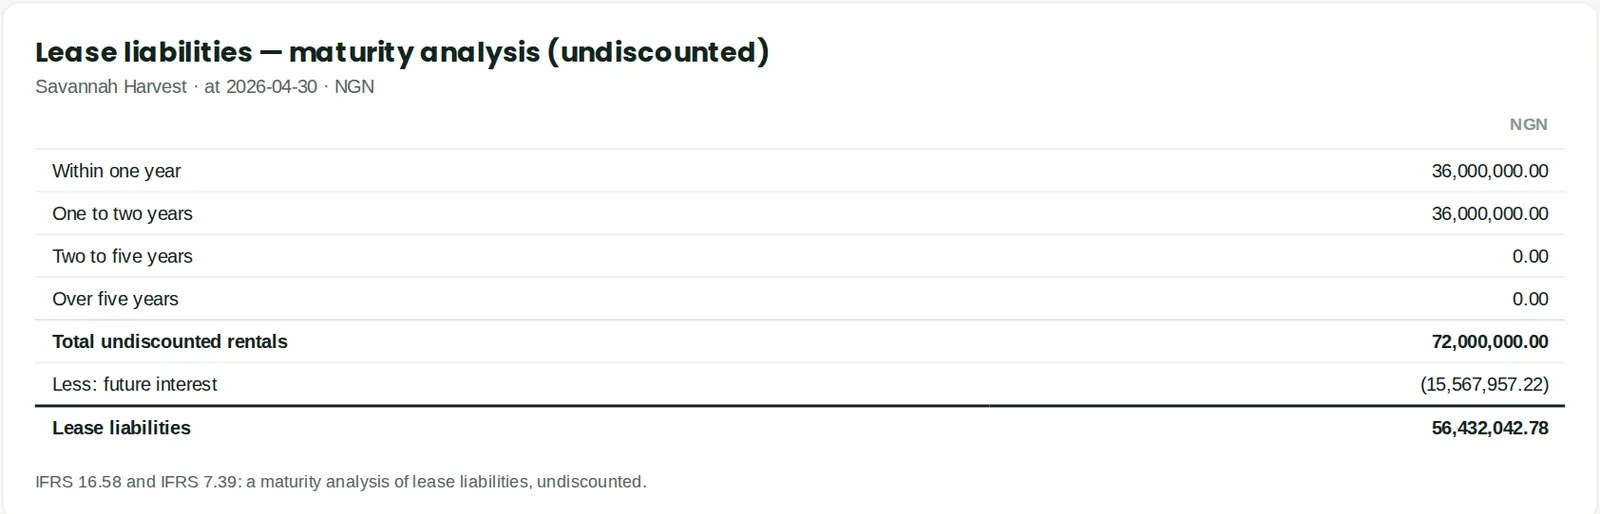
Undiscounted payments by time band (IFRS 7 / IFRS 16.58).
19.82 Impairments, revaluations and transfers

Why
IAS 36 impairments and reversals, revaluations, partial disposals and transfers. Empty: no impairments, revaluations, transfers or partial disposals in the period.
19.83 Depreciation forecast
Why
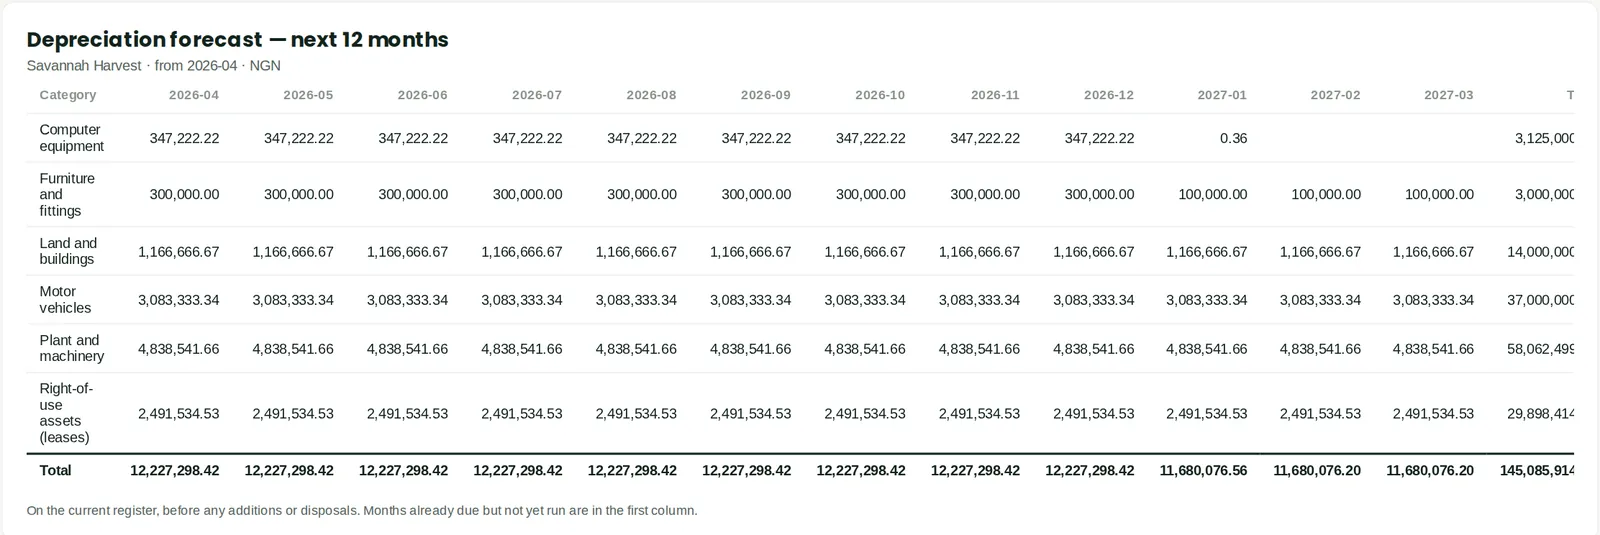
Projected depreciation by month for budgeting.