Steps in this chapter (24)
Every figure in BookTrove comes from the same ledger, so the reports always agree with each other and every amount drills down to the transactions behind it. This chapter shows the main reports for the first quarter of 2026, then the budget, the 13-week cash-flow forecast and report packs.
In the illustration, Chukwudi Okeke, the finance manager, runs the quarter's reports on 2 April 2026, after the March month-end work in chapter 10.
12.1 The Reports page
Why
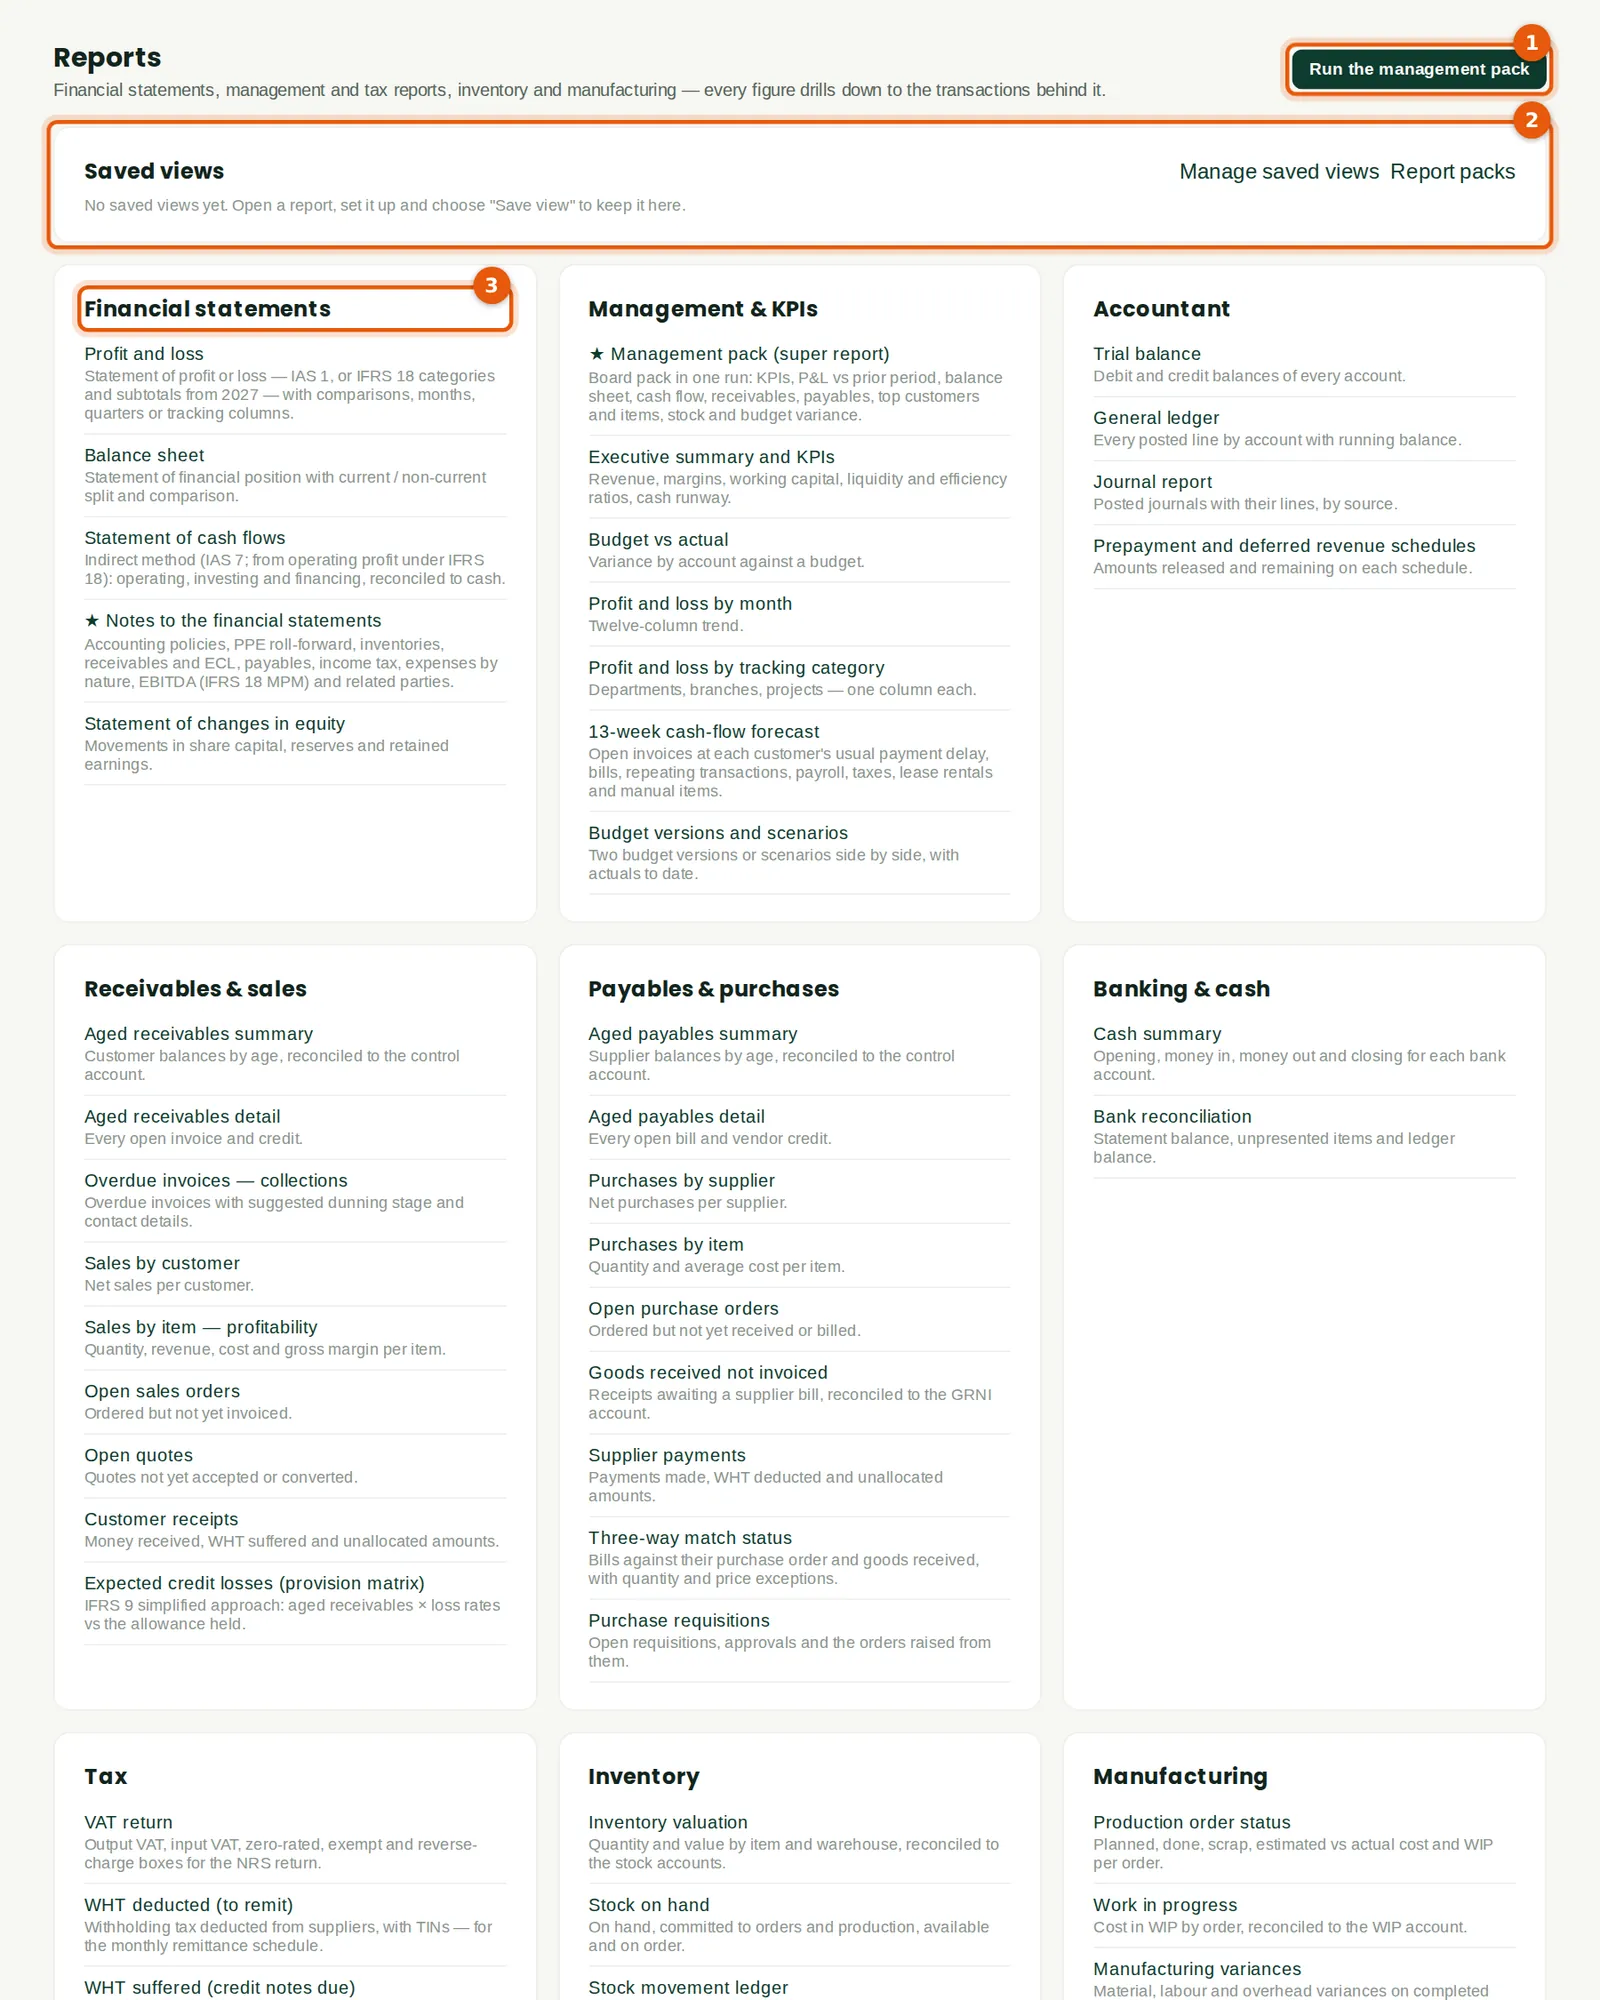
Reports are grouped: financial statements, management and KPIs, the accountant's reports, receivables, payables, banking, tax, inventory and manufacturing. Every report can be run for any period, compared, exported to CSV, downloaded as PDF and printed. Settings you use often can be saved as a view.
Who
Anyone with access to reports. Each person sees only the reports their role allows.
What to do
- Click Run the management pack (1) for the board pack in one run (step 12.14).
- Saved views (2) lists the report settings you have saved; Report packs opens the packs (step 12.20).
- Click a report name — for example under Financial statements (3) — to open it.
12.2 Profit and loss
Why
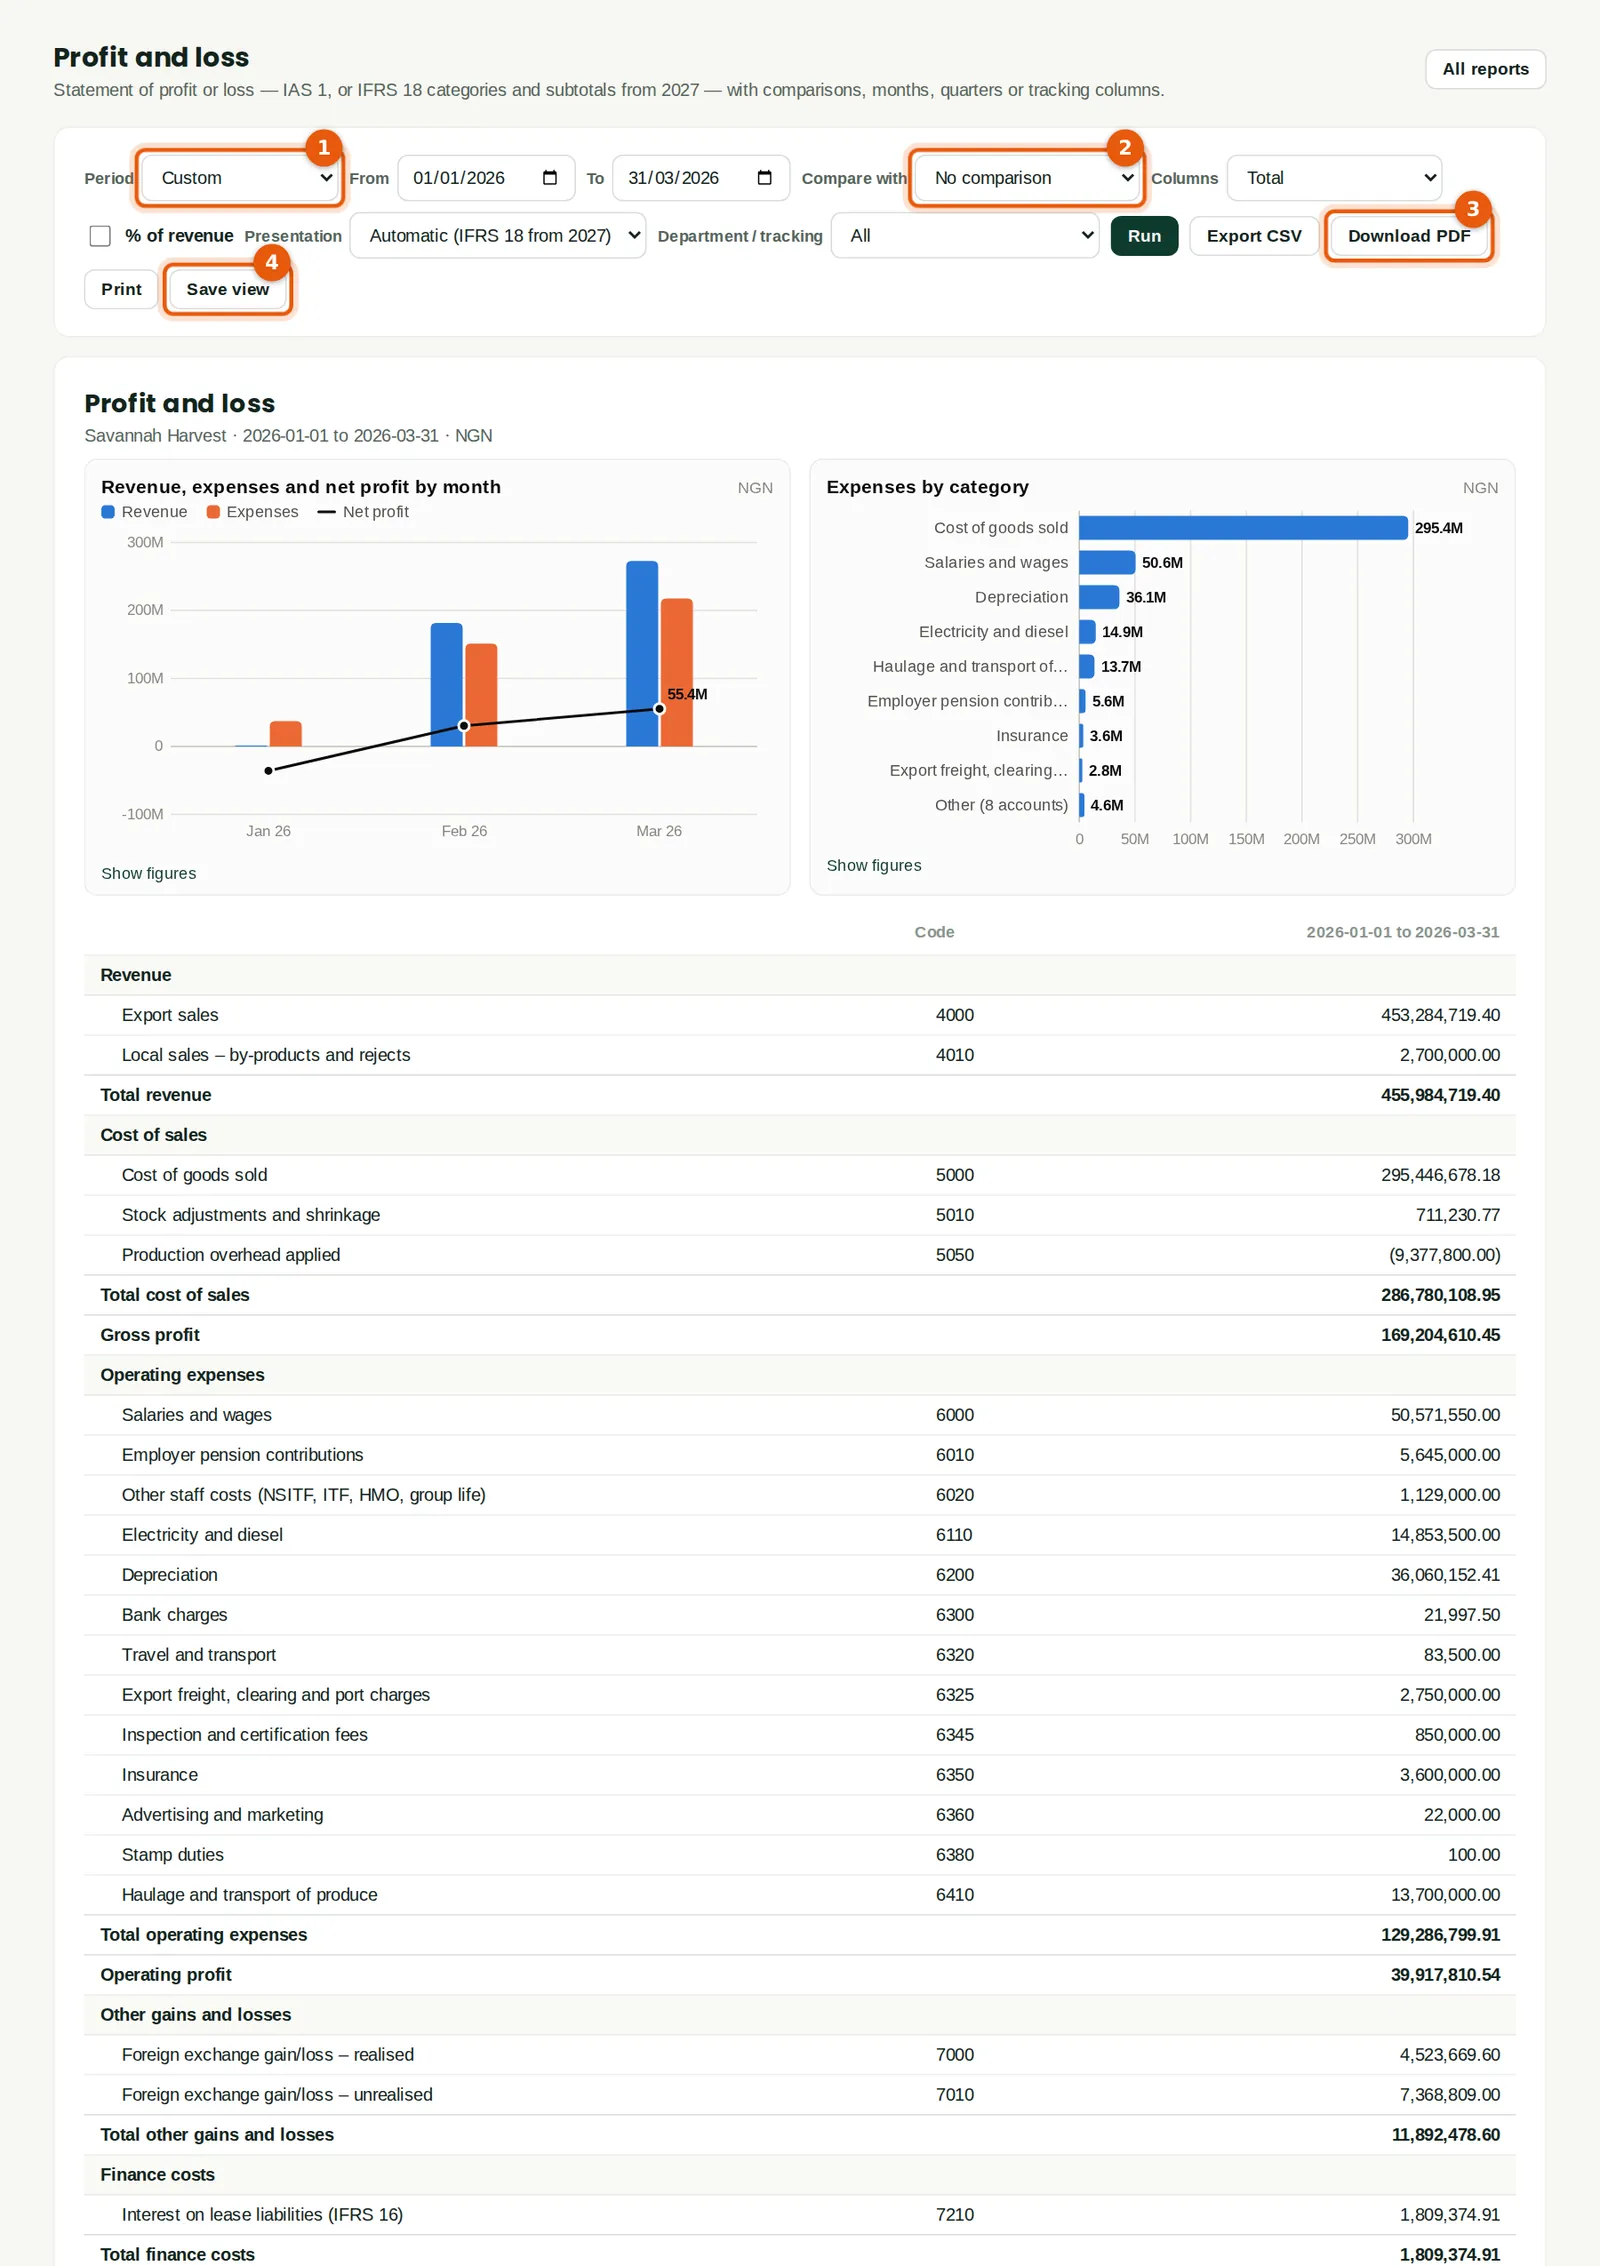
The statement of profit or loss for the period, with charts of revenue, expenses and profit by month and expenses by category. For Savannah Harvest's first quarter, revenue is ₦455,984,719.40, gross profit ₦169,204,610.45 and operating profit ₦39,917,810.54. January had almost no sales because the crop was still being processed, so the profit comes from February and March.
Who
Accountant, finance manager, owners.
What to do
- Choose the period (1): this month, last month, this quarter, year to date or custom dates.
- Compare with (2) adds the previous period or the same period last year. Columns can show months or quarters, and % of revenue adds a percentage column.
- Download PDF (3) for a printable copy; Export CSV for a spreadsheet.
- Save view (4) keeps these settings under a name on the Reports page.
- Click any amount to see the transactions behind it.
12.3 Profit and loss by month
Why
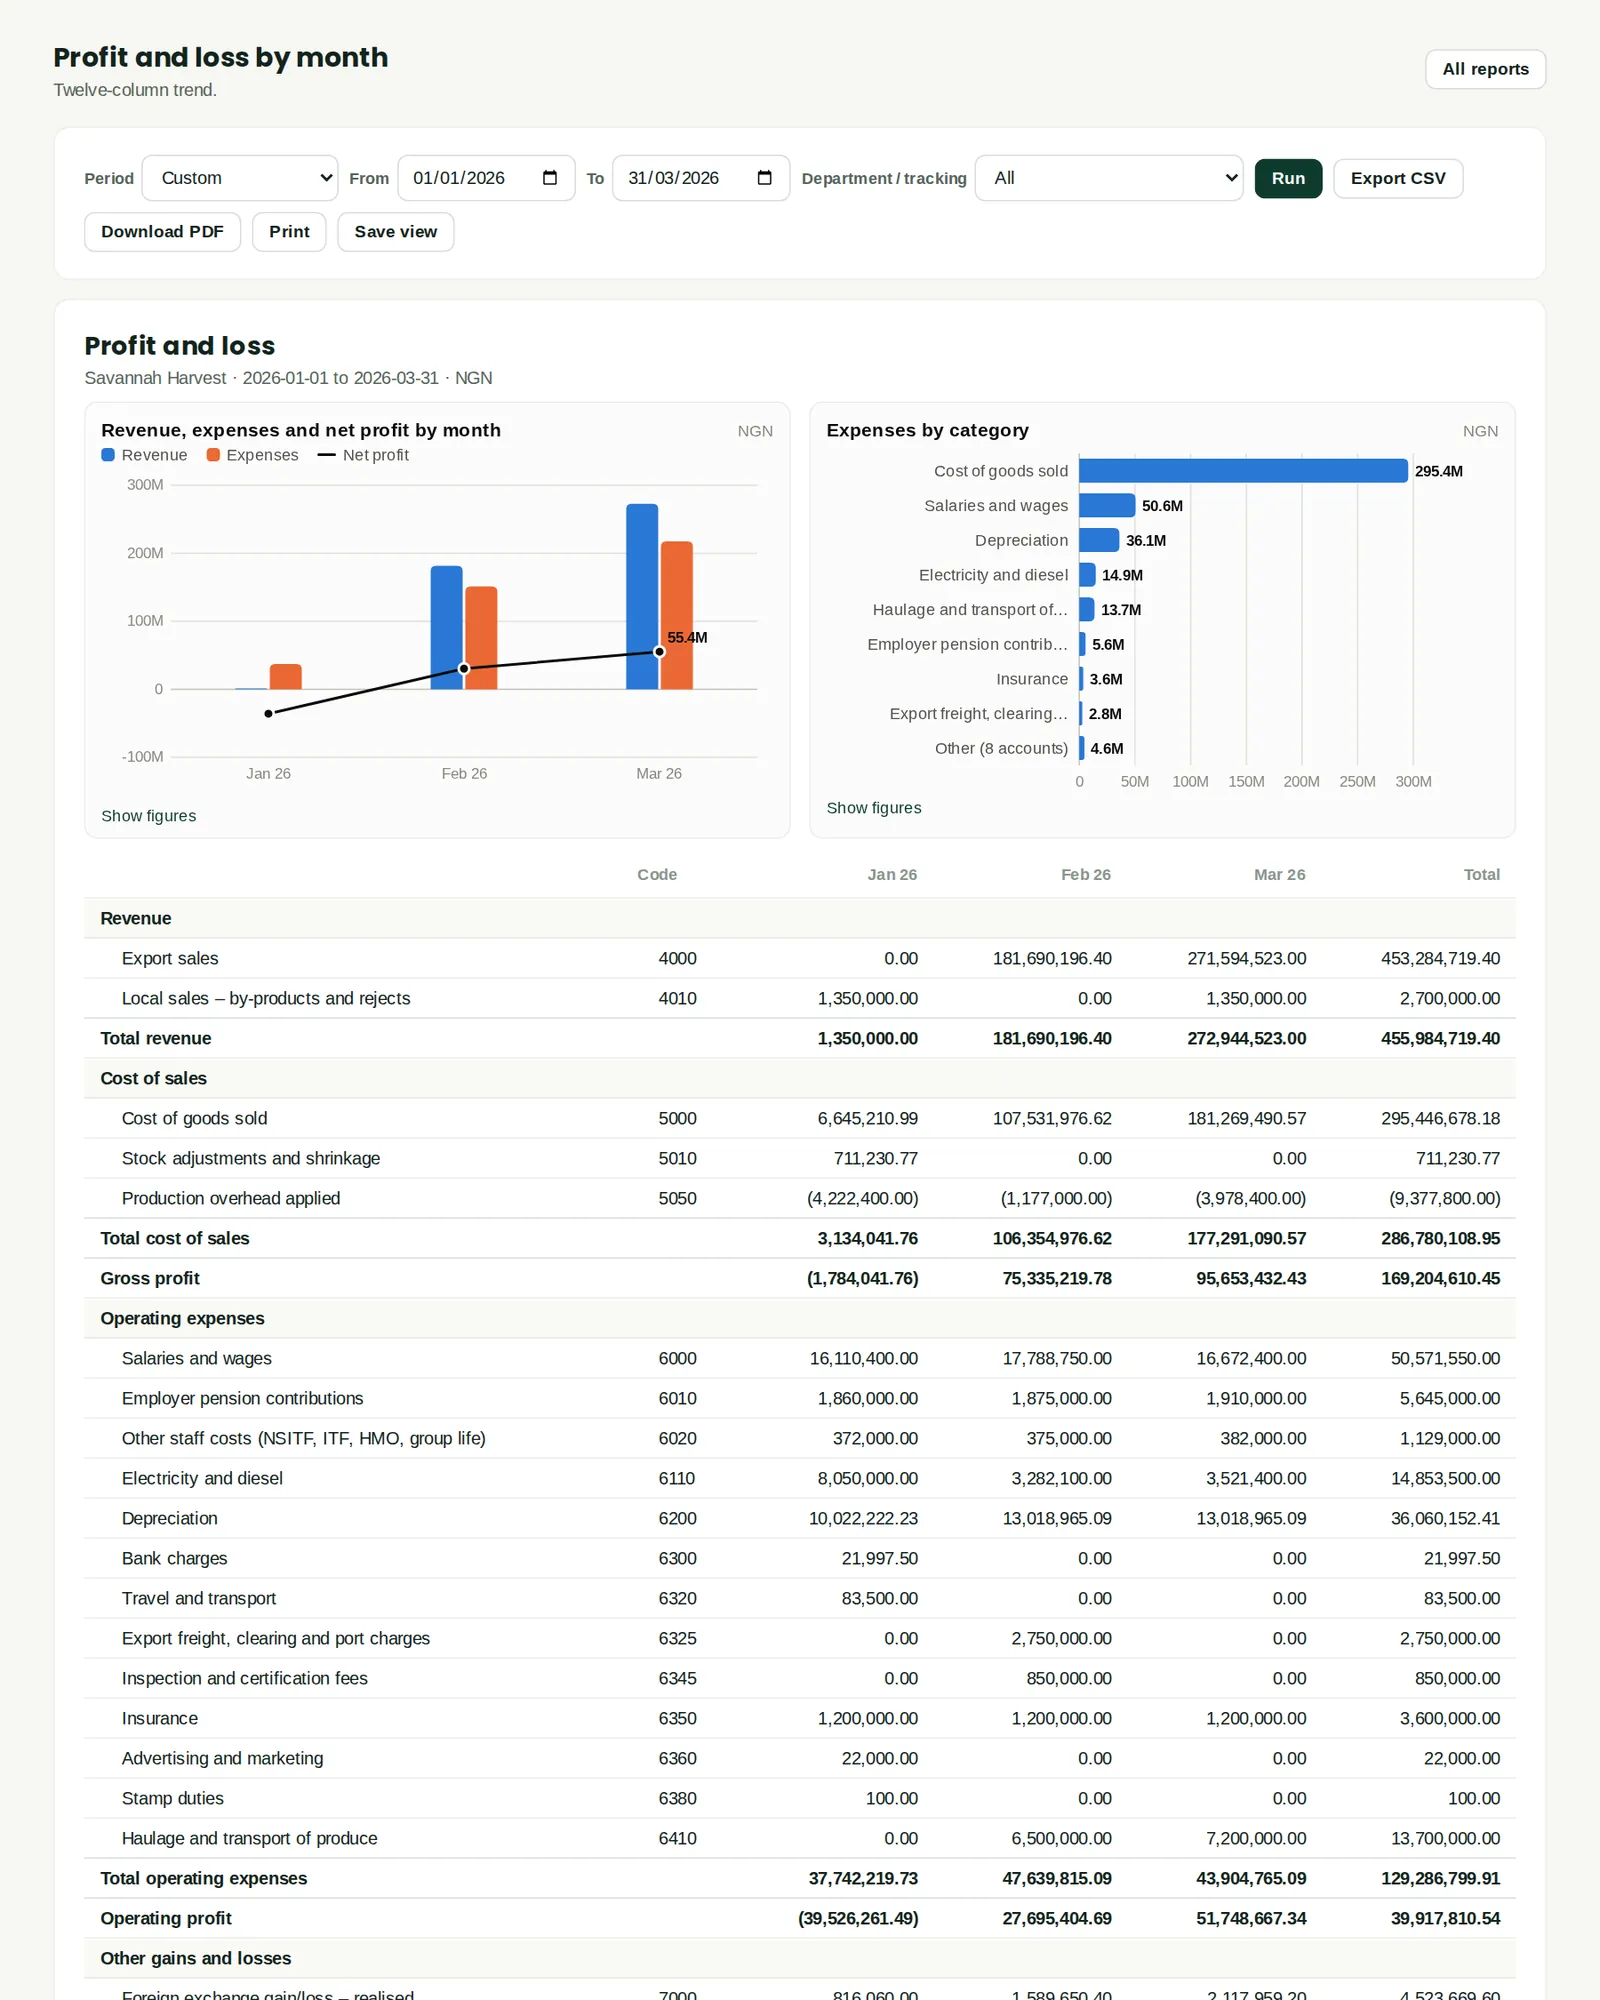
The same statement with a column for each month, to see the trend: in Savannah Harvest's case, the first export sales in February and a bigger March.
Who
Finance manager, owners.
What to do
- Open Reports → Profit and loss by month, choose the period and click Run.
12.4 Balance sheet
Why
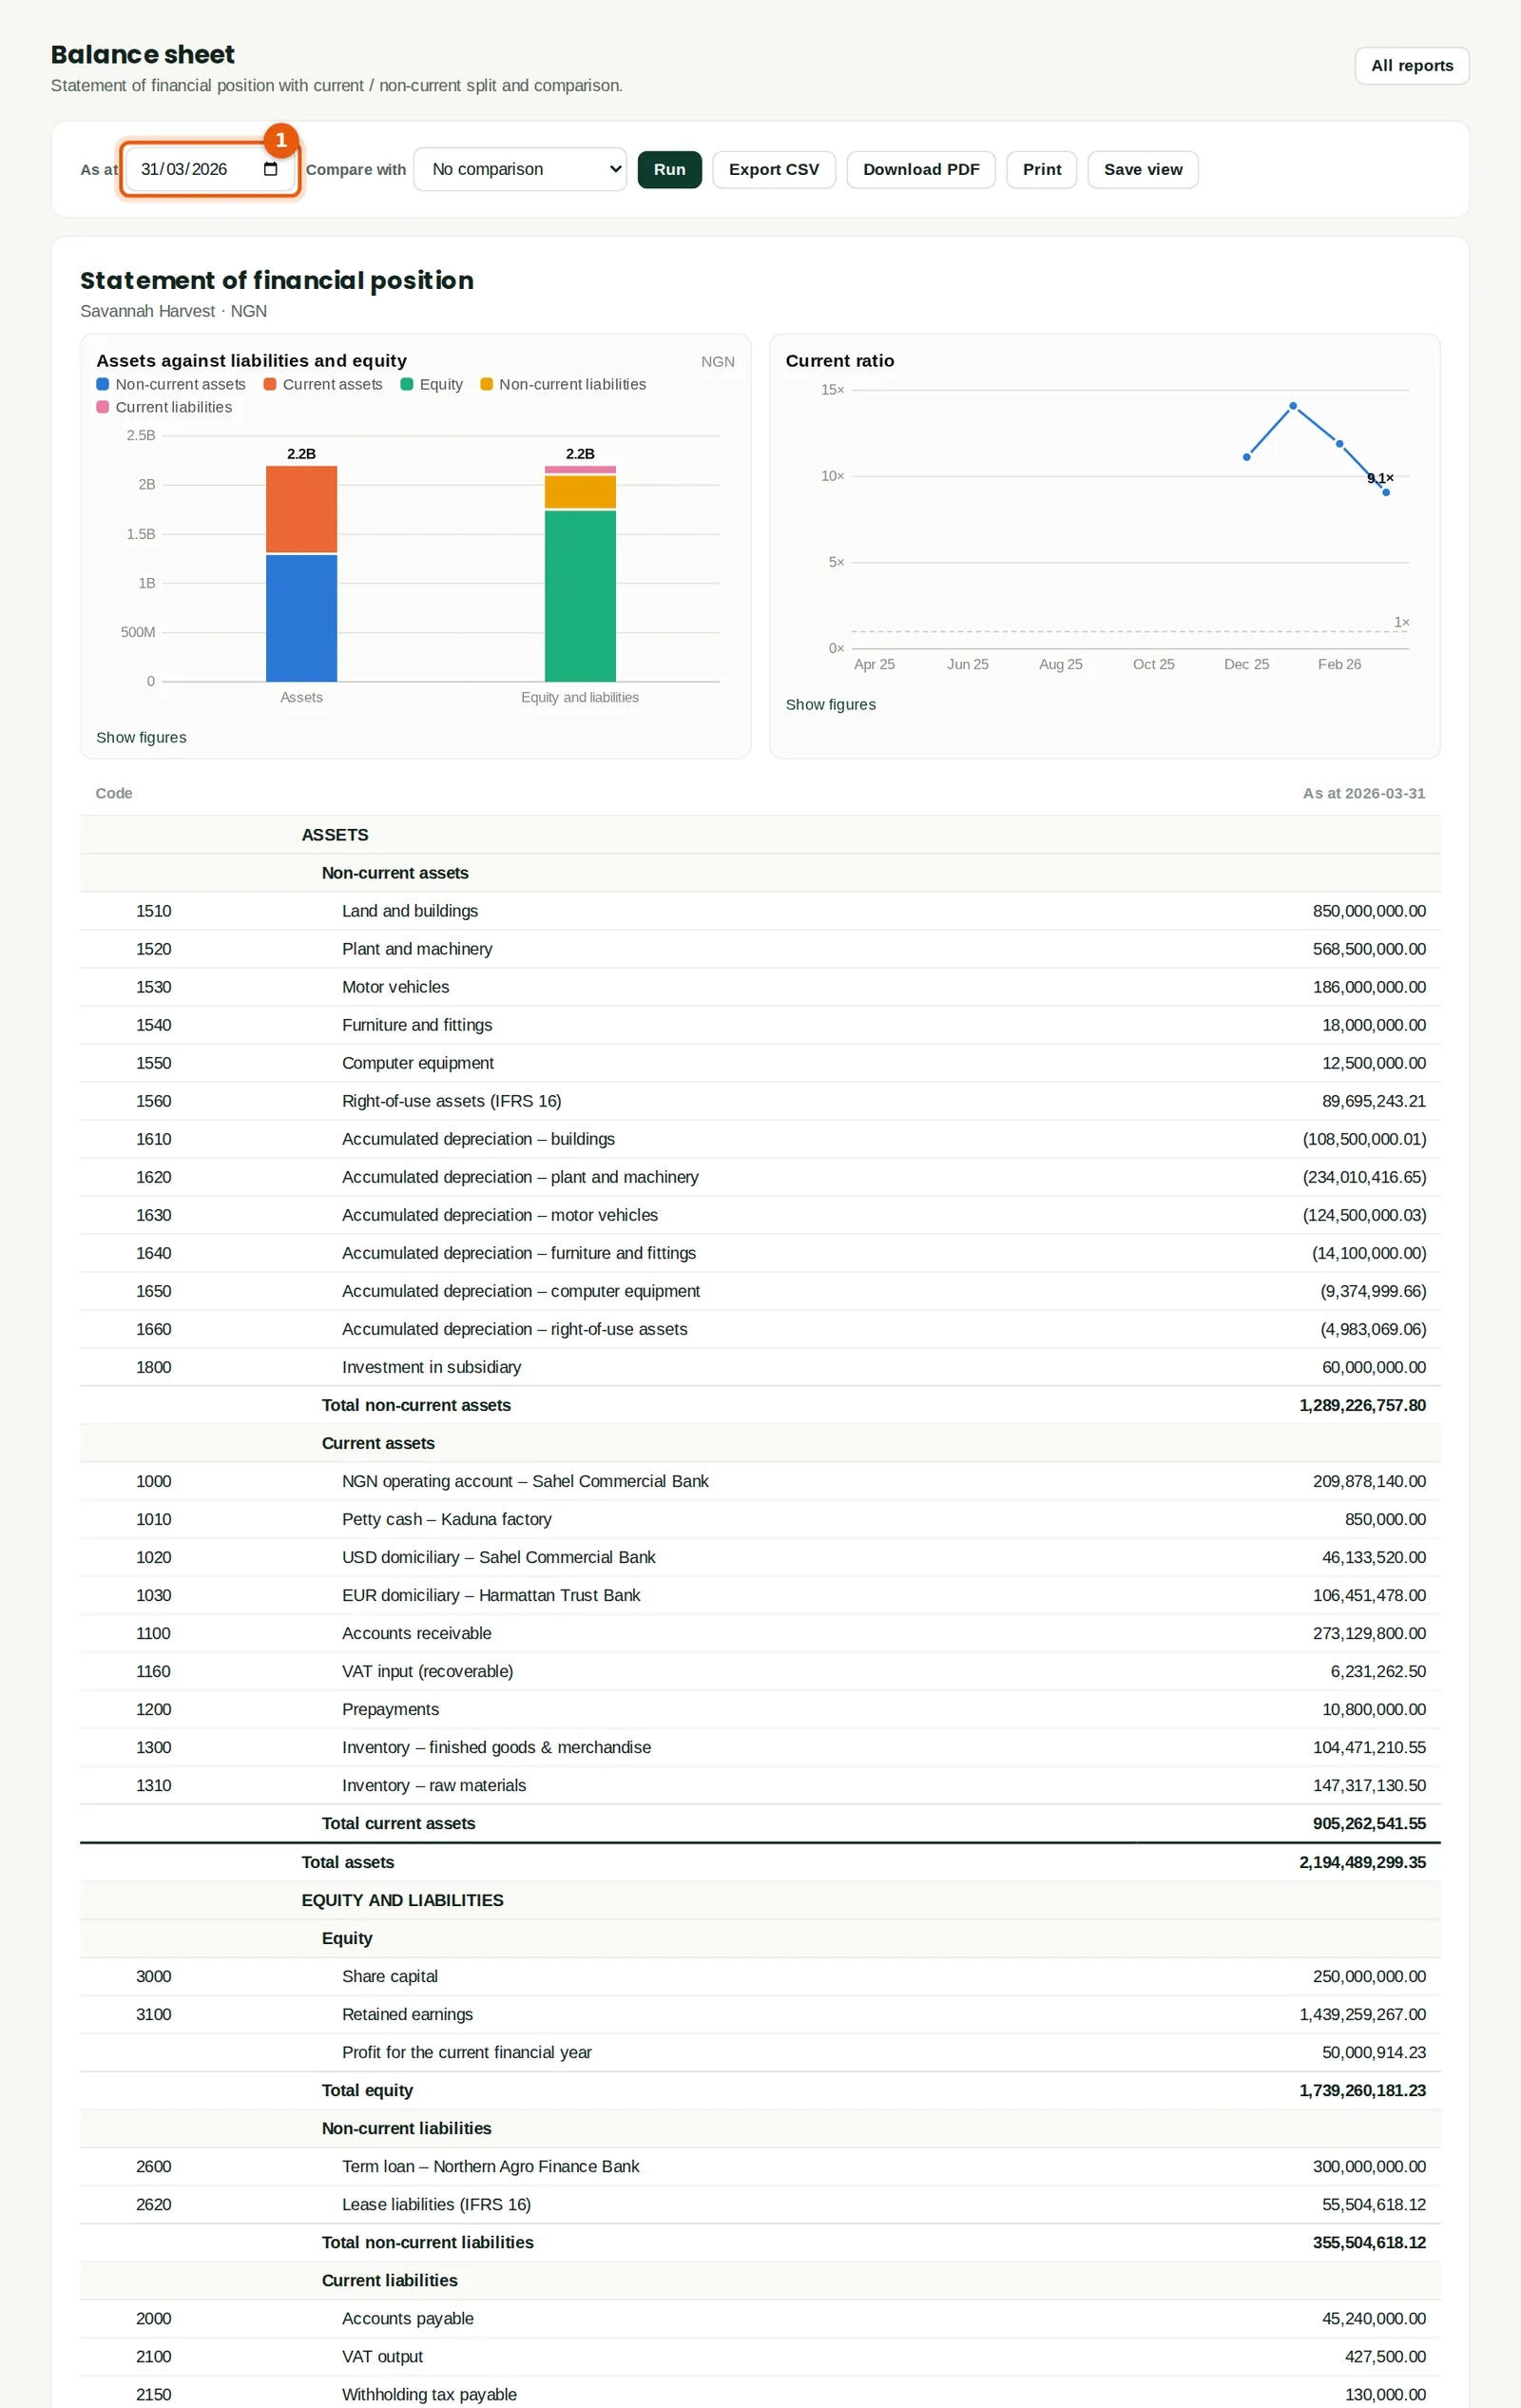
Assets, liabilities and equity at a date, split into current and non-current. The profit for the current financial year shows as a separate line in equity until the year-end close moves it to retained earnings (chapter 10). Total assets at 31 March are ₦2,194,489,299.35. The charts show assets against liabilities and equity, and the current ratio over time.
Who
Accountant, finance manager, owners.
What to do
- Set the As at date (1) and click Run. Compare with adds an earlier date.
12.5 Statement of cash flows
Why
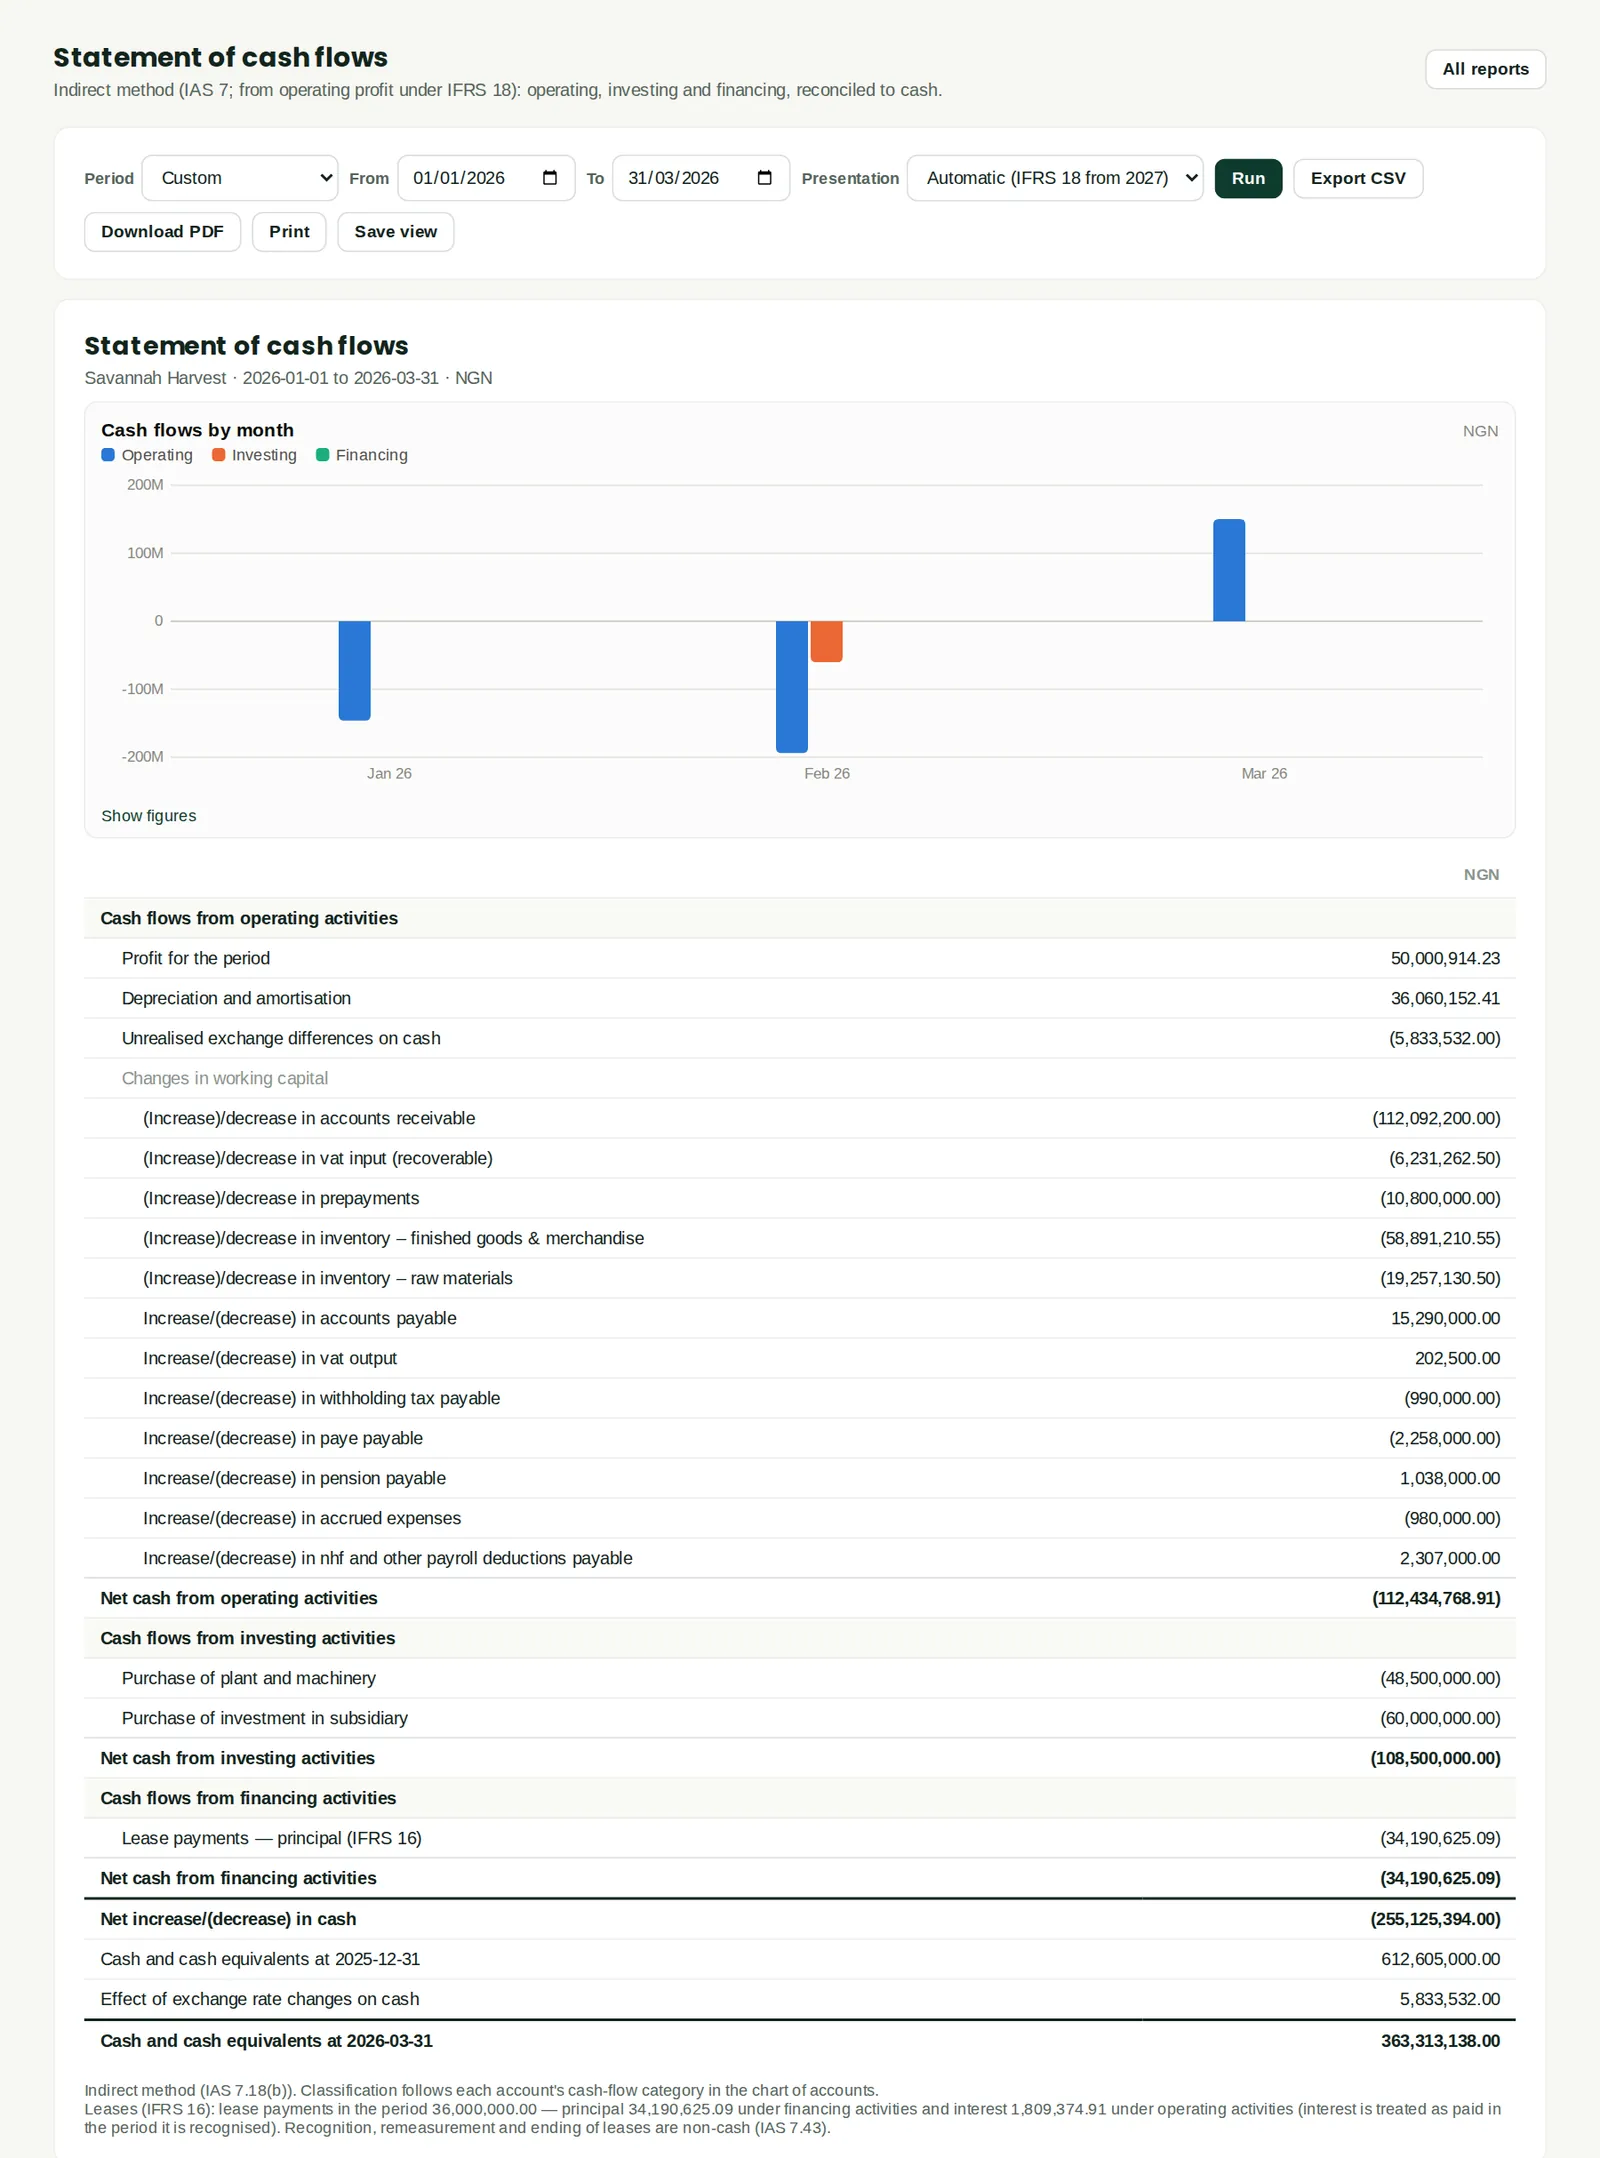
The indirect method (IAS 7): profit for the period, adjusted for non-cash items such as depreciation and unrealised exchange differences, and for changes in working capital; then investing and financing. Each account's cash-flow category comes from the chart of accounts. Savannah Harvest's operations used ₦112,434,768.91 of cash in the quarter although it made a profit, mainly because export customers owed more at 31 March and stock was built up for shipment. It paid ₦108,500,000 for the new sorter and the shares in its subsidiary (investing). Under financing, Lease payments — principal (IFRS 16) is the part of the ₦36,000,000 head office rental paid that reduced the lease liability, ₦34,190,625.09; the rest, ₦1,809,374.91, is interest, shown in operating activities. The note under the statement gives these figures. The statement ends with cash of ₦363,313,138.00, the total of the bank and cash accounts in the balance sheet.
Who
Accountant, finance manager.
What to do
- Choose the period and click Run. From 2027 the Presentation setting follows IFRS 18 automatically.
12.6 Trial balance
Why
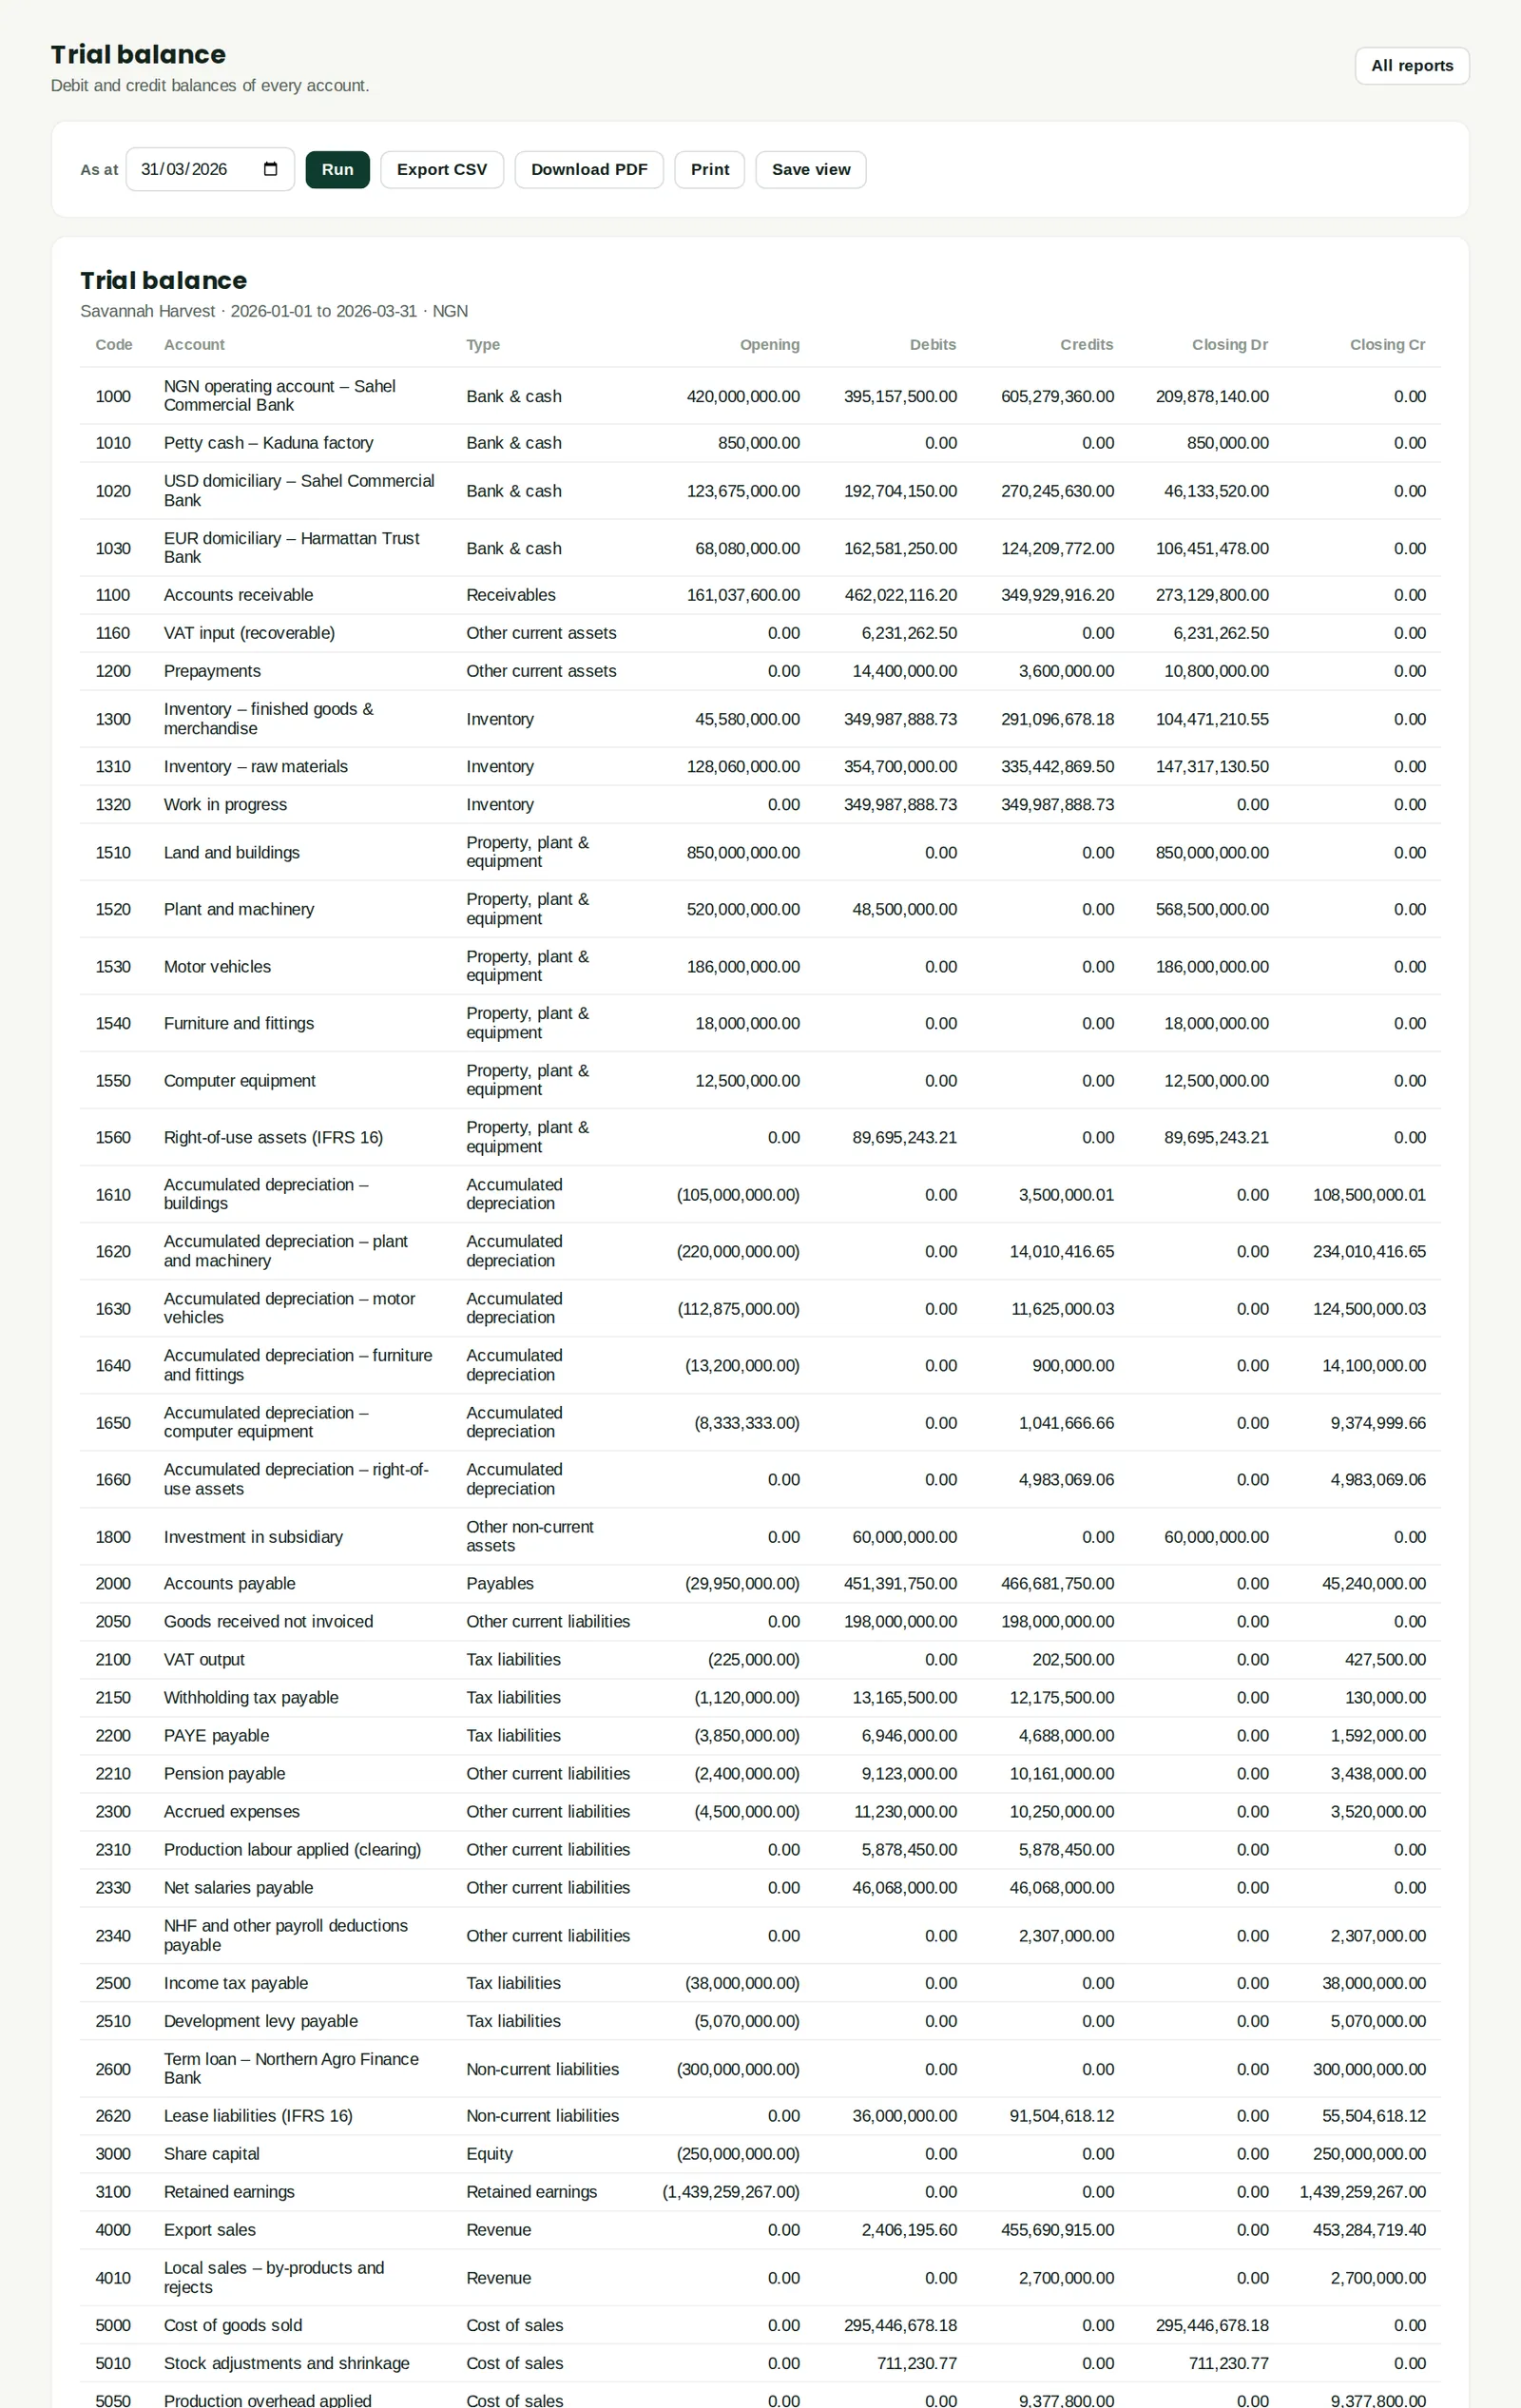
Every account with its opening balance, debits and credits for the period, and closing balance. It is the starting point for the year-end file and for the auditors. Click an account to open its general ledger.
Who
Accountant; the external accountant and auditors.
What to do
- Set the As at date and click Run. Export CSV gives the auditors a spreadsheet.
12.7 Aged receivables
Why
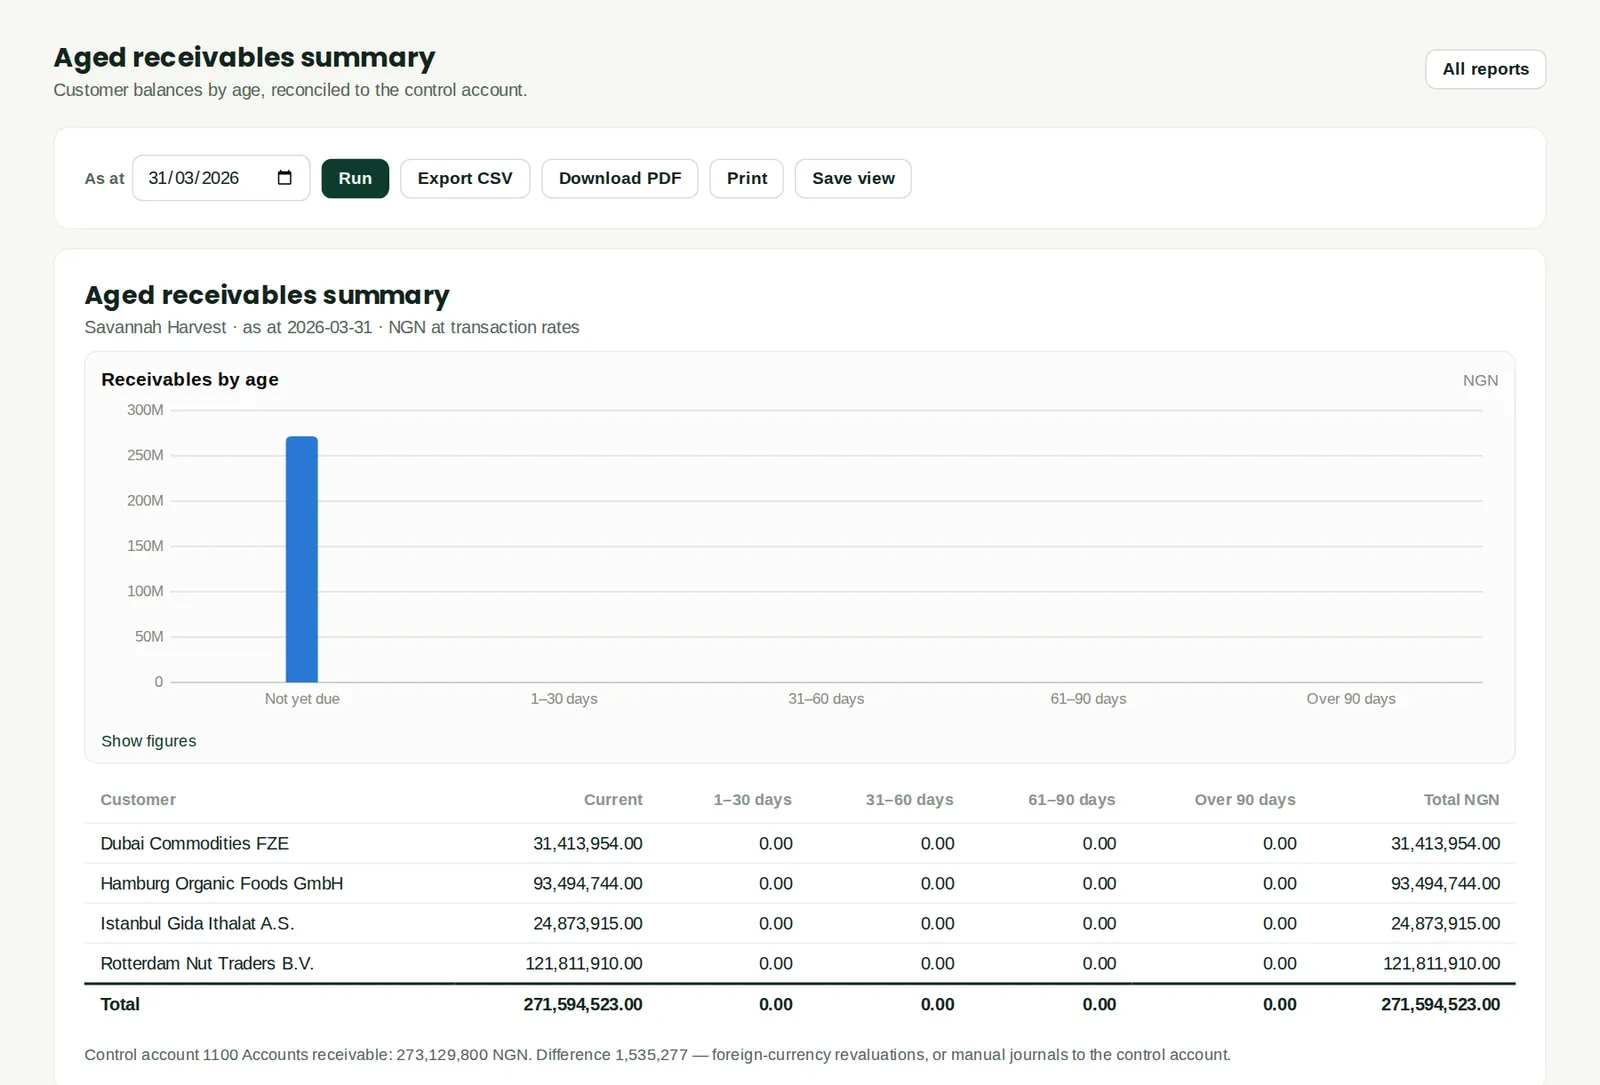
What each customer owes, by age, in naira at the rates of the invoices. All of Savannah Harvest's export customers are within terms at 31 March. The note below the table reconciles the report to the Accounts receivable control account; here the difference is the foreign-currency revaluation at 31 March (chapter 10), which is booked in the ledger but not on the individual invoices.
Who
Credit controller, finance manager.
What to do
- Set the date and click Run. The detail version lists every open invoice and credit note.
12.8 Aged payables
Why
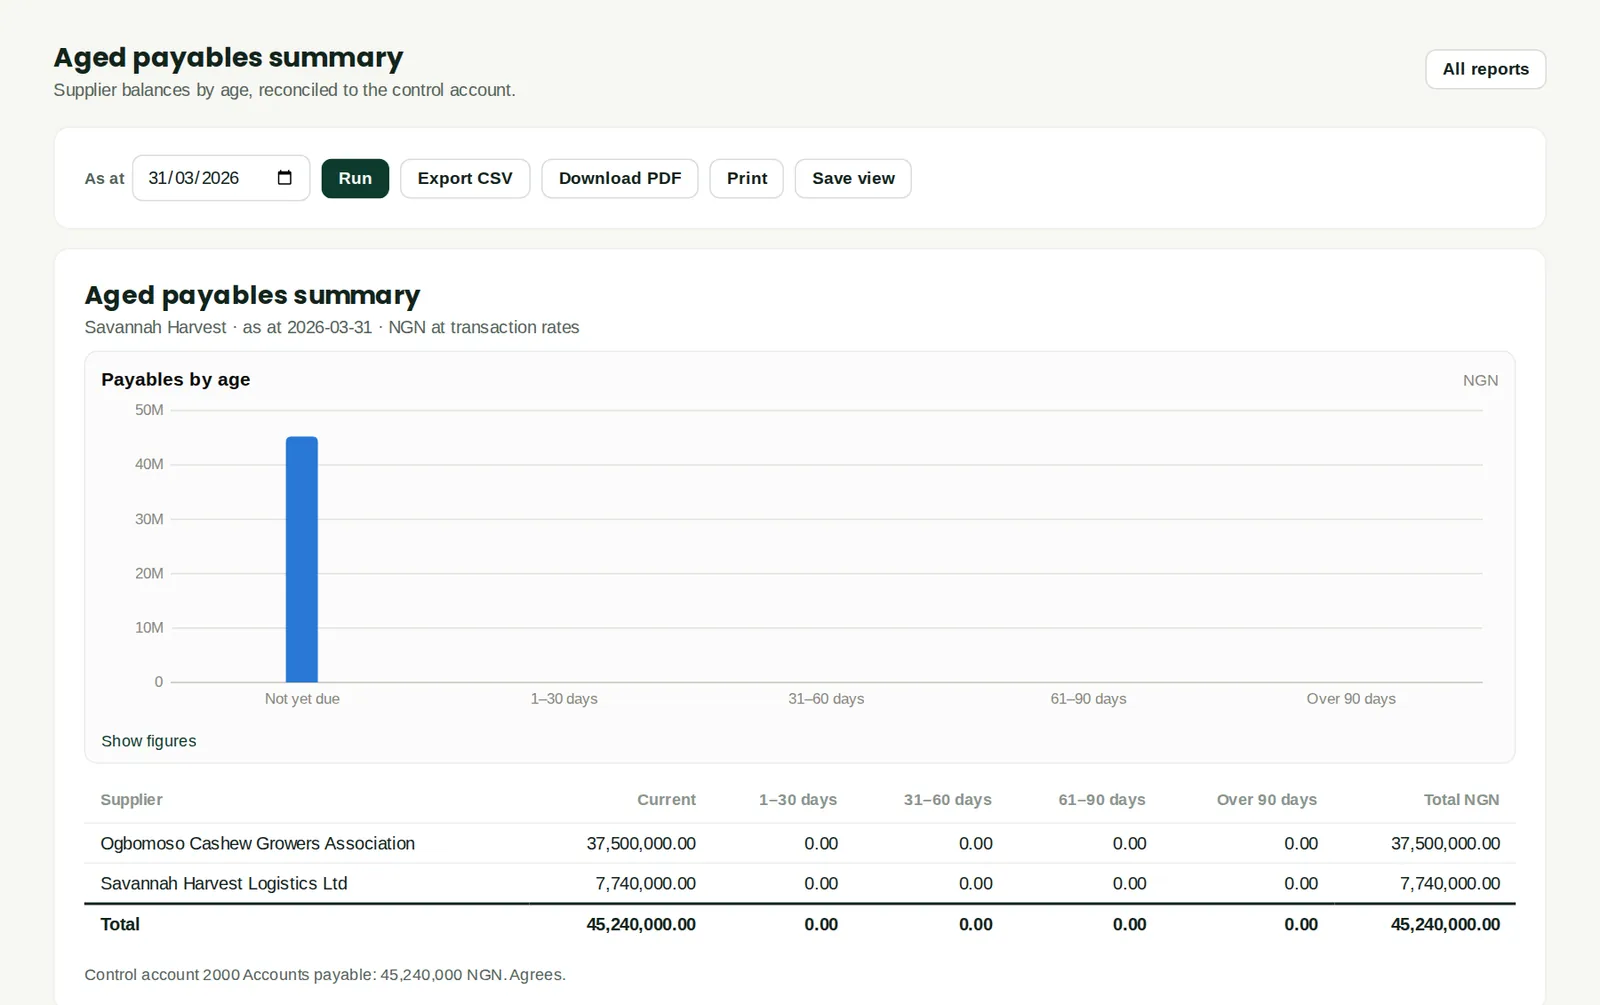
What the company owes each supplier, by age. It agrees to the Accounts payable control account (the note under the table says so). Here the only balances are the Ogbomoso cashew bill and the March haulage from the subsidiary.
Who
Finance manager, purchasing.
What to do
- Set the date and click Run. Use it with the supplier payment run (chapter 5).
12.9 Inventory valuation
Why
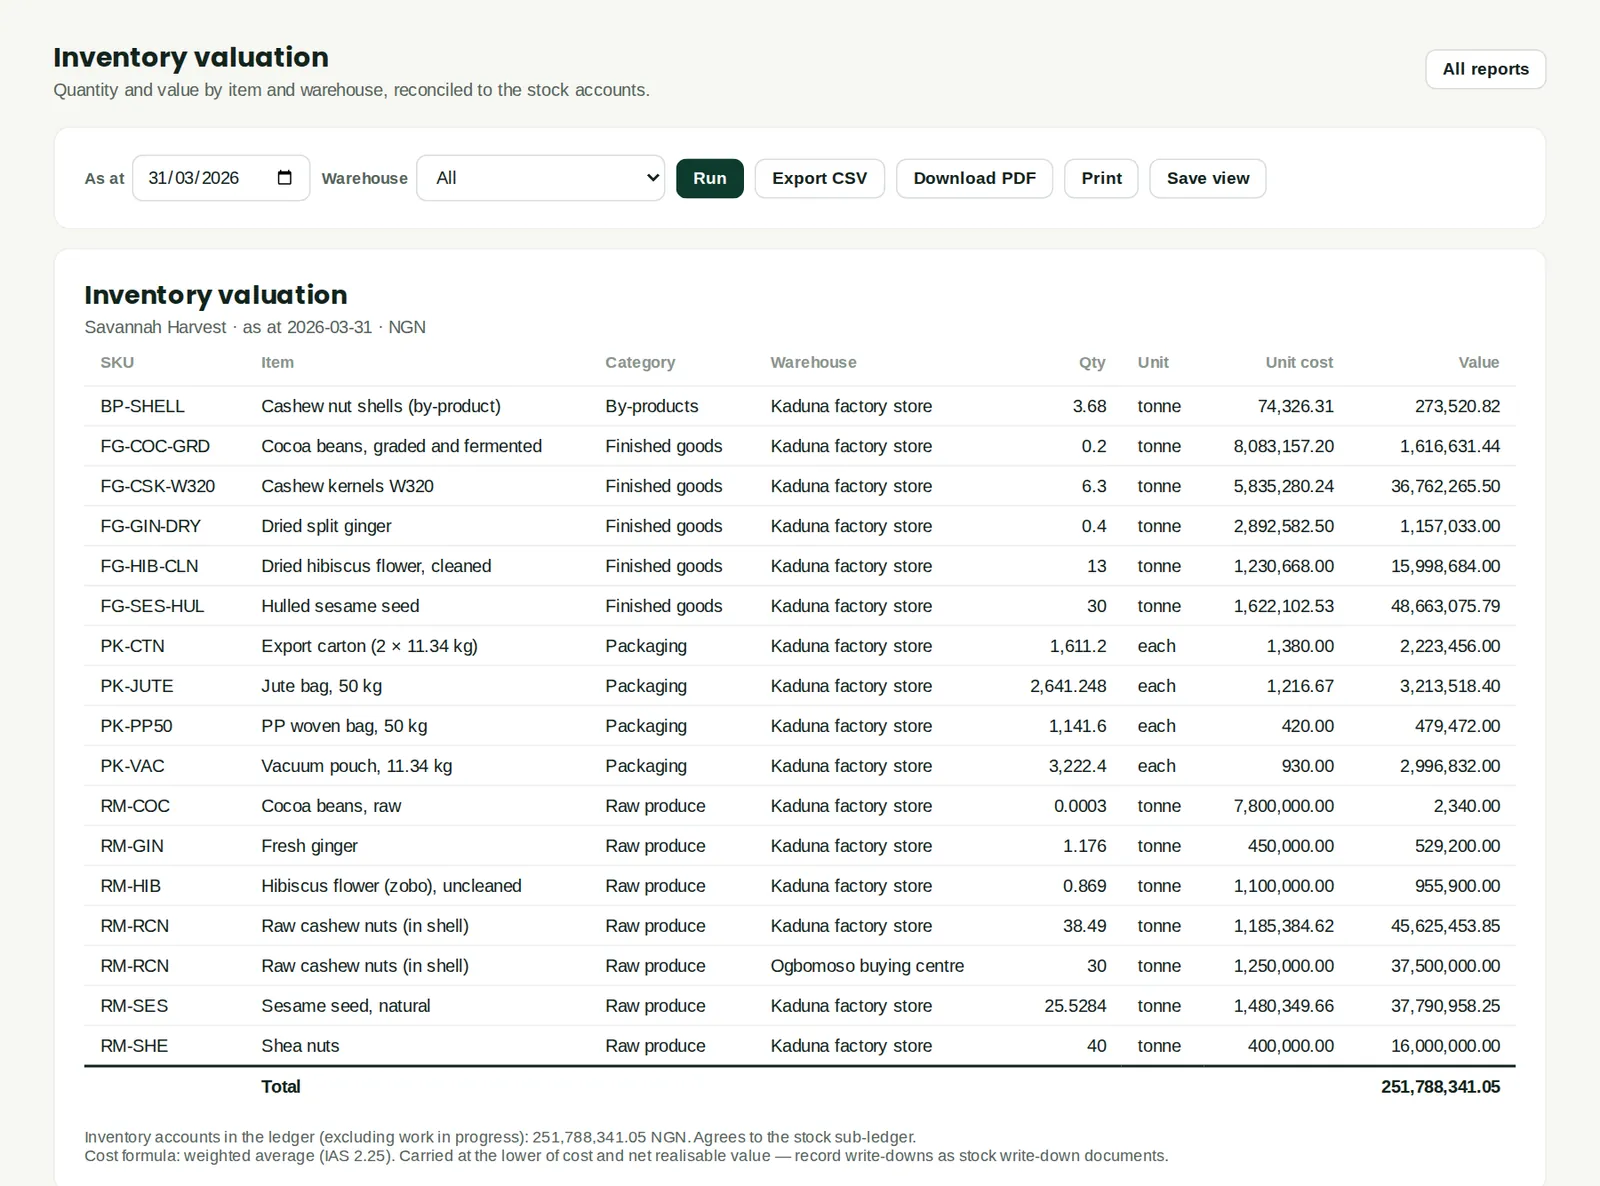
Quantity, unit cost and value of every item in every warehouse, at weighted-average cost (IAS 2). The note under the table agrees the total to the stock accounts in the ledger. Items are carried at the lower of cost and net realisable value: record any write-down as a stock write-down document.
Who
Accountant, inventory manager.
What to do
- Set the date and, if you need one location, the warehouse. Click Run.
12.10 Stock movement ledger
Why
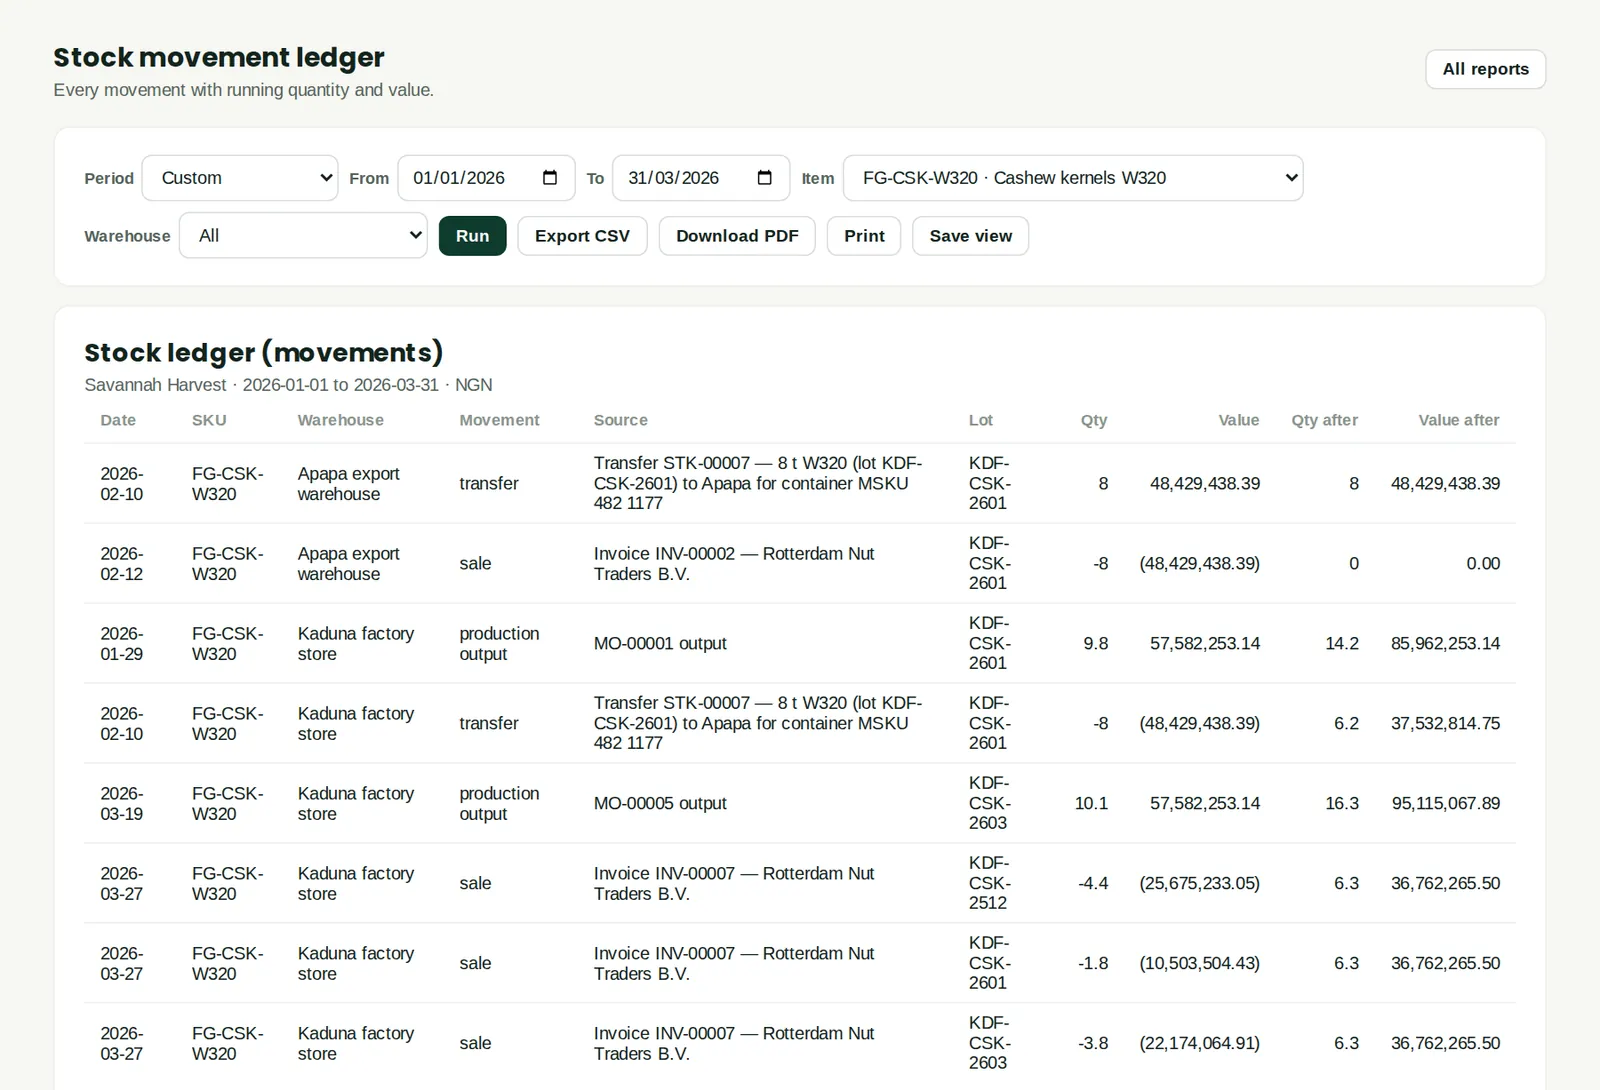
Every movement of an item — goods received, production output, transfers, sales and adjustments — with the lot, quantity, value and the running quantity and value afterwards. The lines are grouped by warehouse. Here the kernels made in January (lot KDF-CSK-2601) and March (lot KDF-CSK-2603) can be followed to the export invoices.
Who
Inventory manager, accountant.
What to do
- Choose the period and the item (and a warehouse if you want one). Click Run.
12.11 Sales by item — profitability
Why
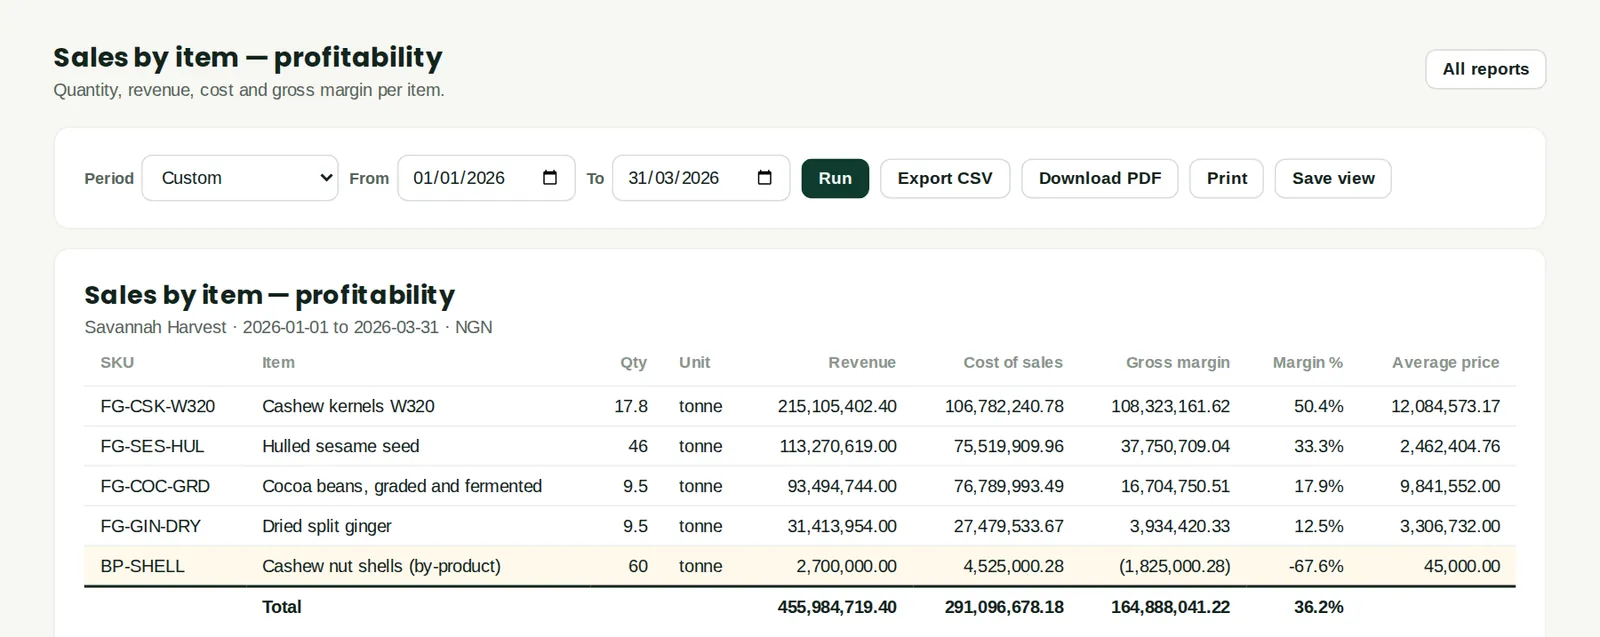
Quantity sold, revenue, cost of sales and gross margin for each product. The cost is the actual production cost carried through the stock, so the margins are real. Cashew kernels, the main product, earn the highest margin; the shells sold locally are a by-product carried at a cost above their selling price.
Who
Owners, sales, finance manager.
What to do
- Choose the period and click Run. Click a product to see its invoices.
12.12 Profit and loss by product line
Why
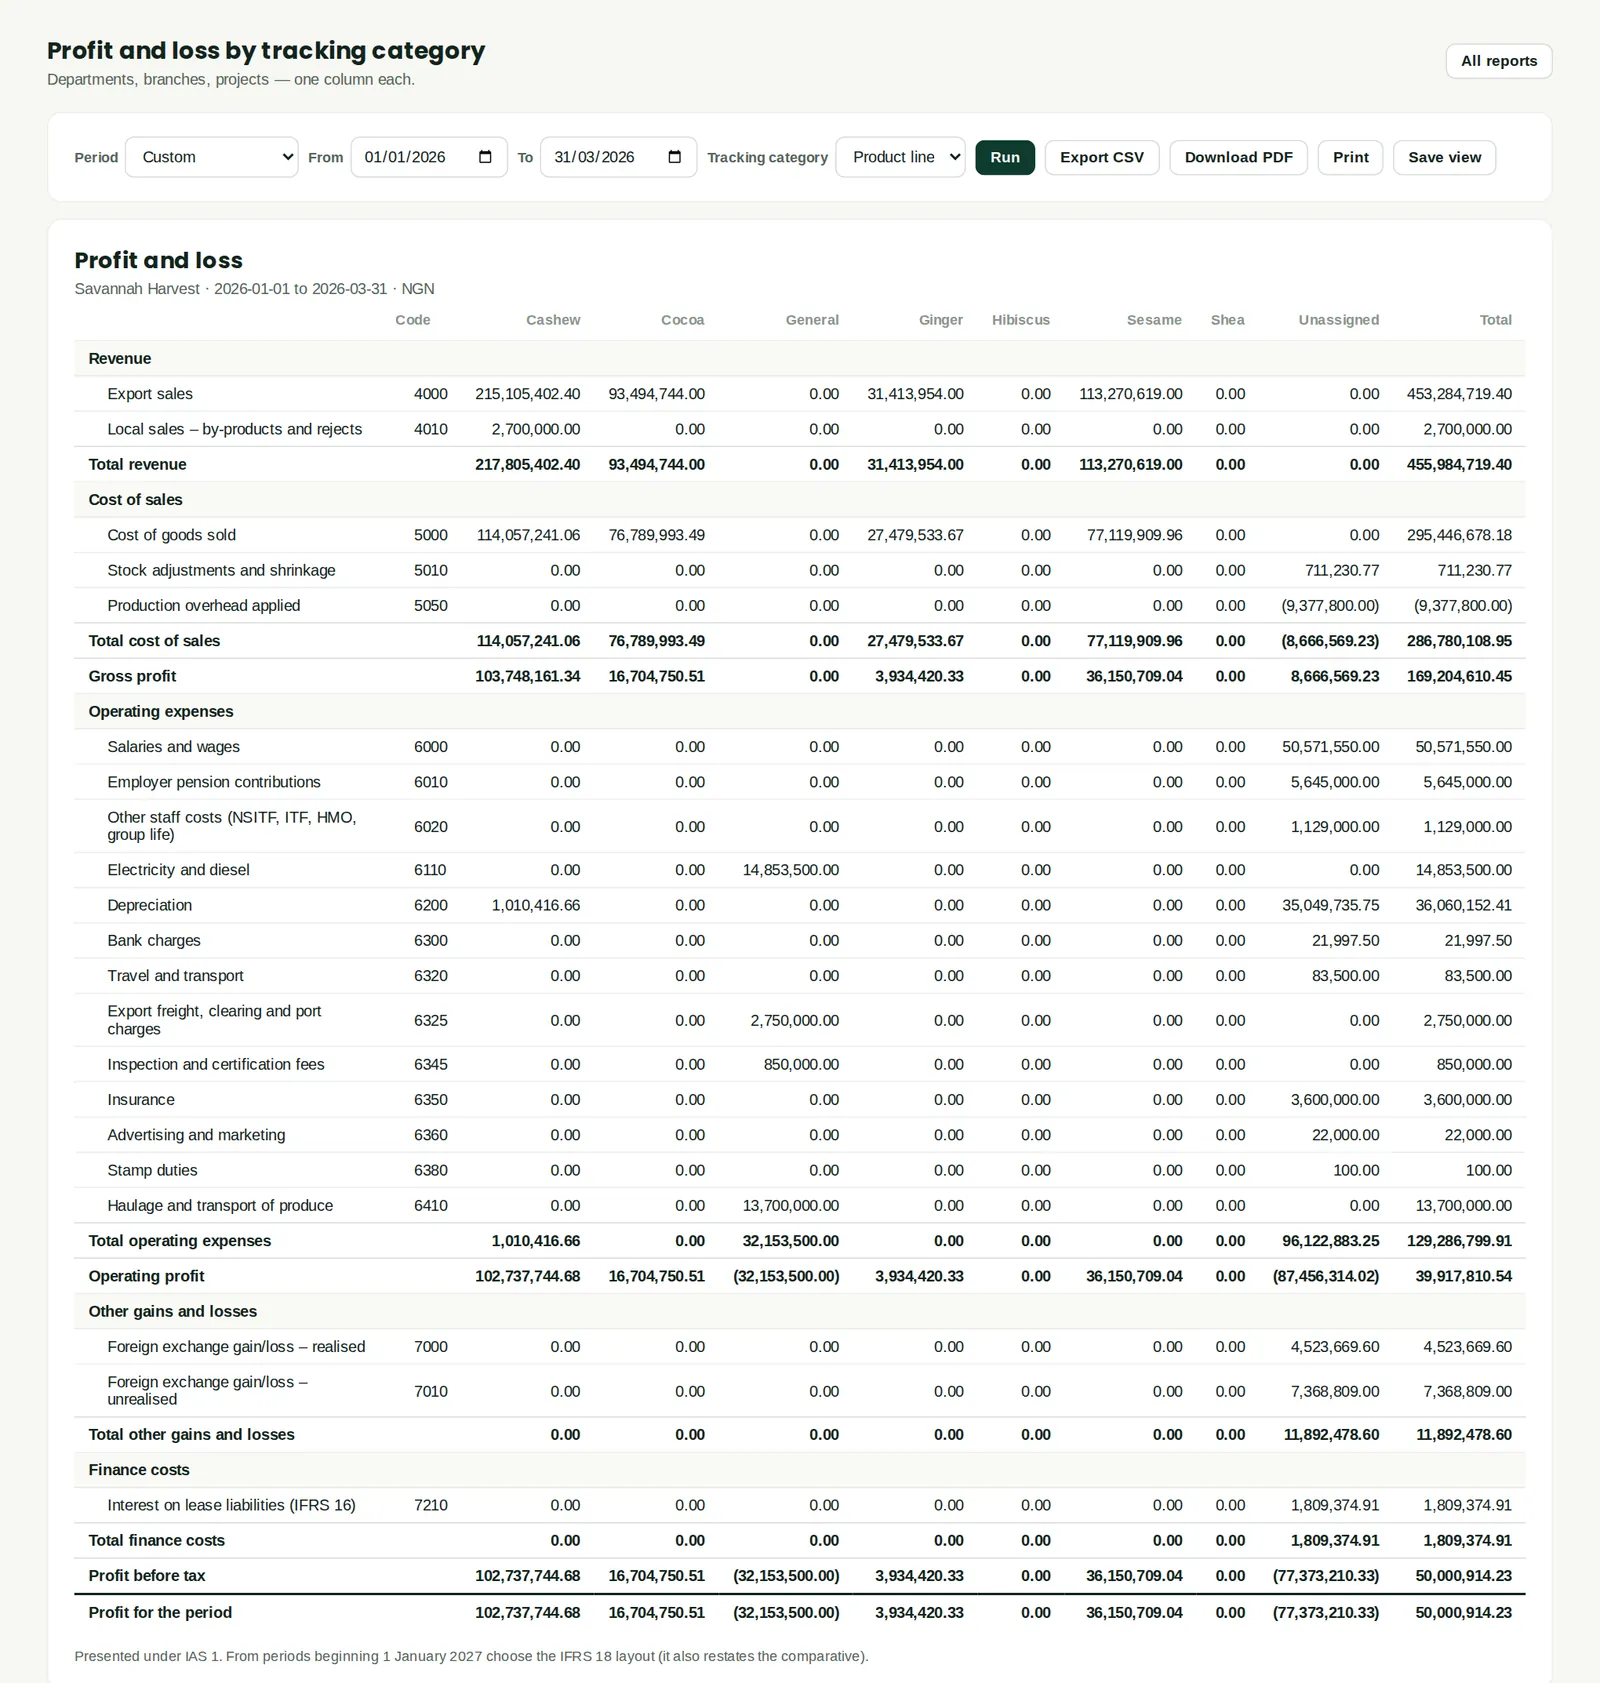
The tracking categories set up in chapter 2 (Location and Product line) give a profit and loss with one column for each value. Costs that were not tagged show under Unassigned; tag them on the documents, or share them out with a journal, to get a full product-line profit.
Who
Owners, finance manager.
What to do
- Open Profit and loss by tracking category, choose the tracking category and the period, and click Run.
12.13 Executive summary and KPIs
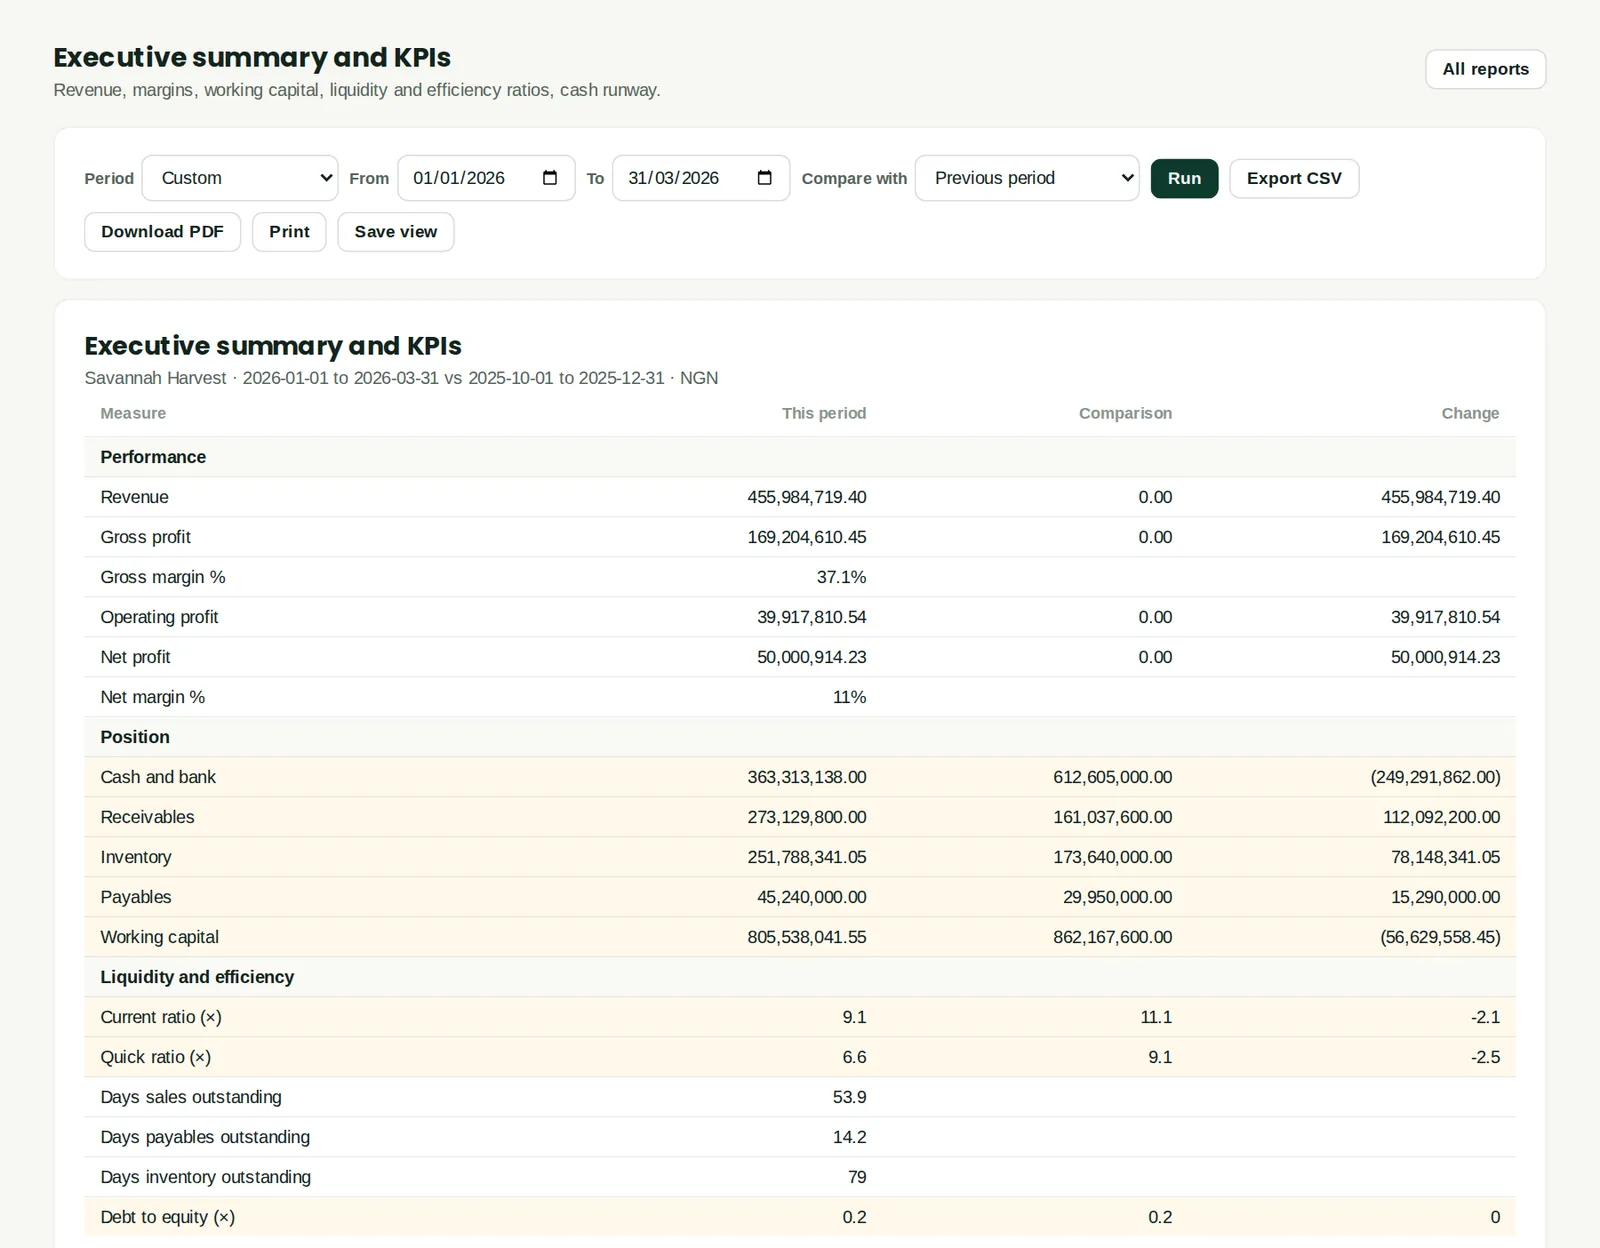
Why
Revenue, margins, cash, receivables, stock, payables and working capital, with liquidity and efficiency ratios: current and quick ratio, days sales outstanding, days payables and days inventory. The comparison here is with October–December 2025, before Savannah Harvest moved to BookTrove, so only the balance sheet figures (from the opening balances) have a comparison.
Who
Owners, board.
What to do
- Choose the period and a comparison, and click Run.
12.14 The management pack
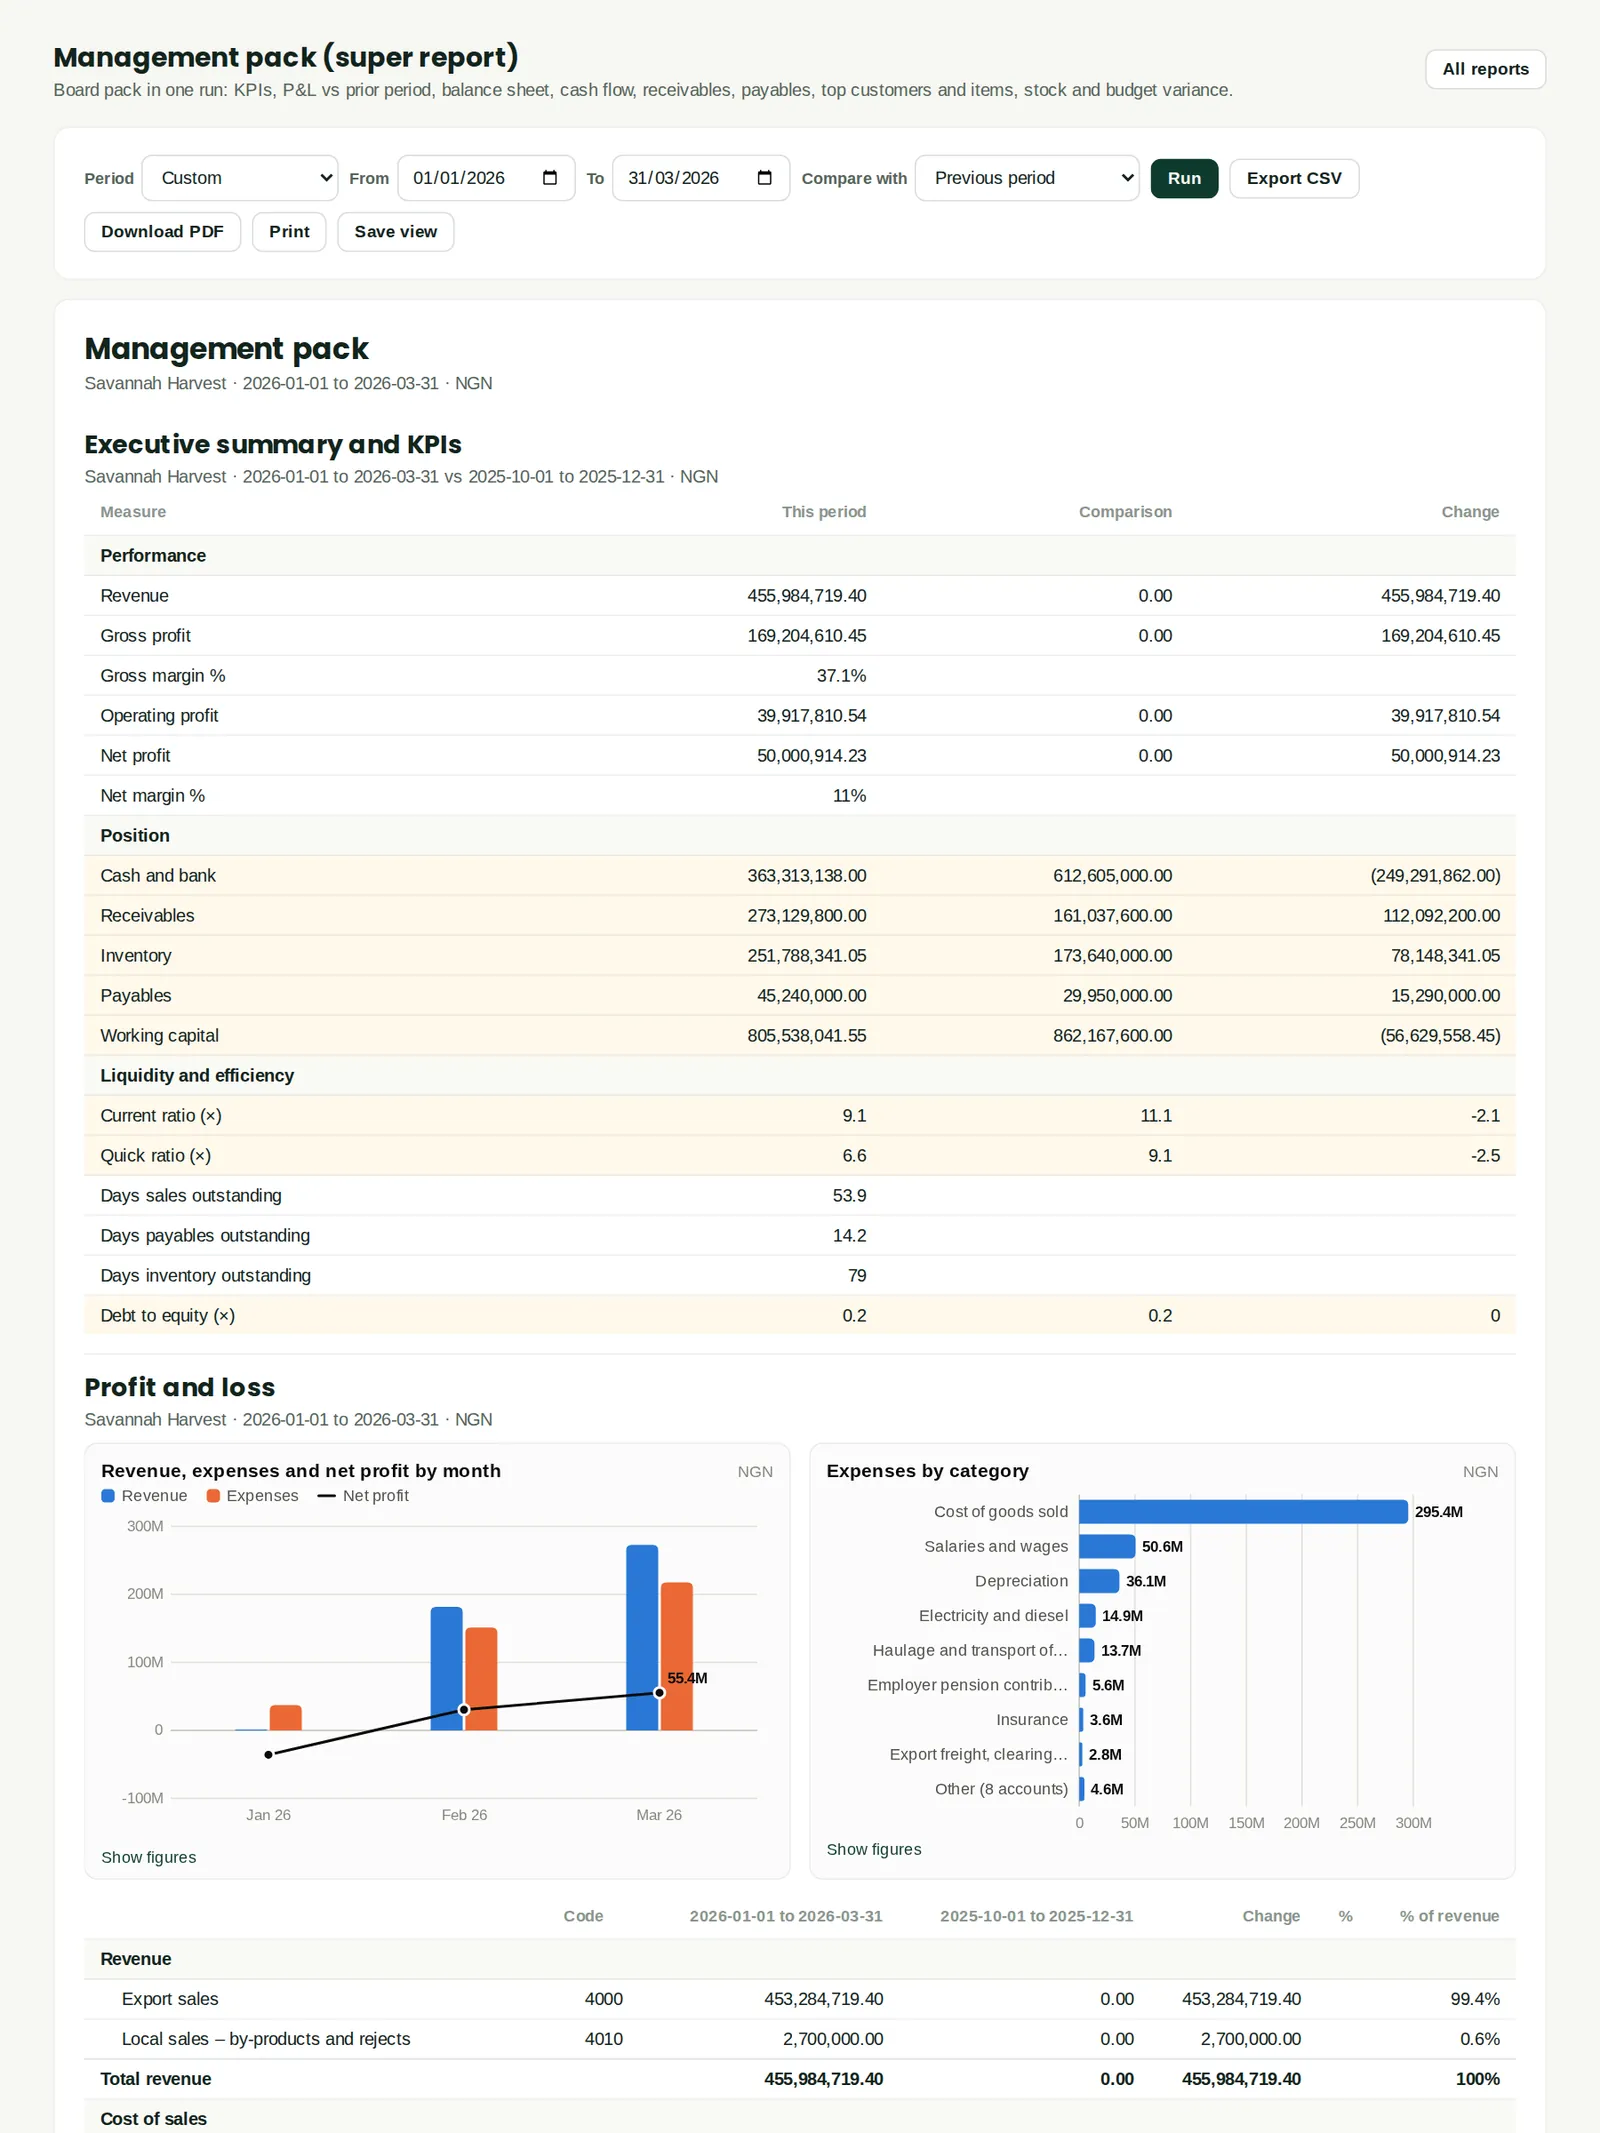
Why
One report containing the executive summary, profit and loss against the comparison, balance sheet, cash flow, receivables and payables, top customers and items, stock and budget variance. Download it as a PDF for the board.
Who
Finance manager, for the board.
What to do
- Click Run the management pack on the Reports page (or on the dashboard), choose the period and the comparison, and click Run.
- Click Download PDF.
12.15 Enter the budget
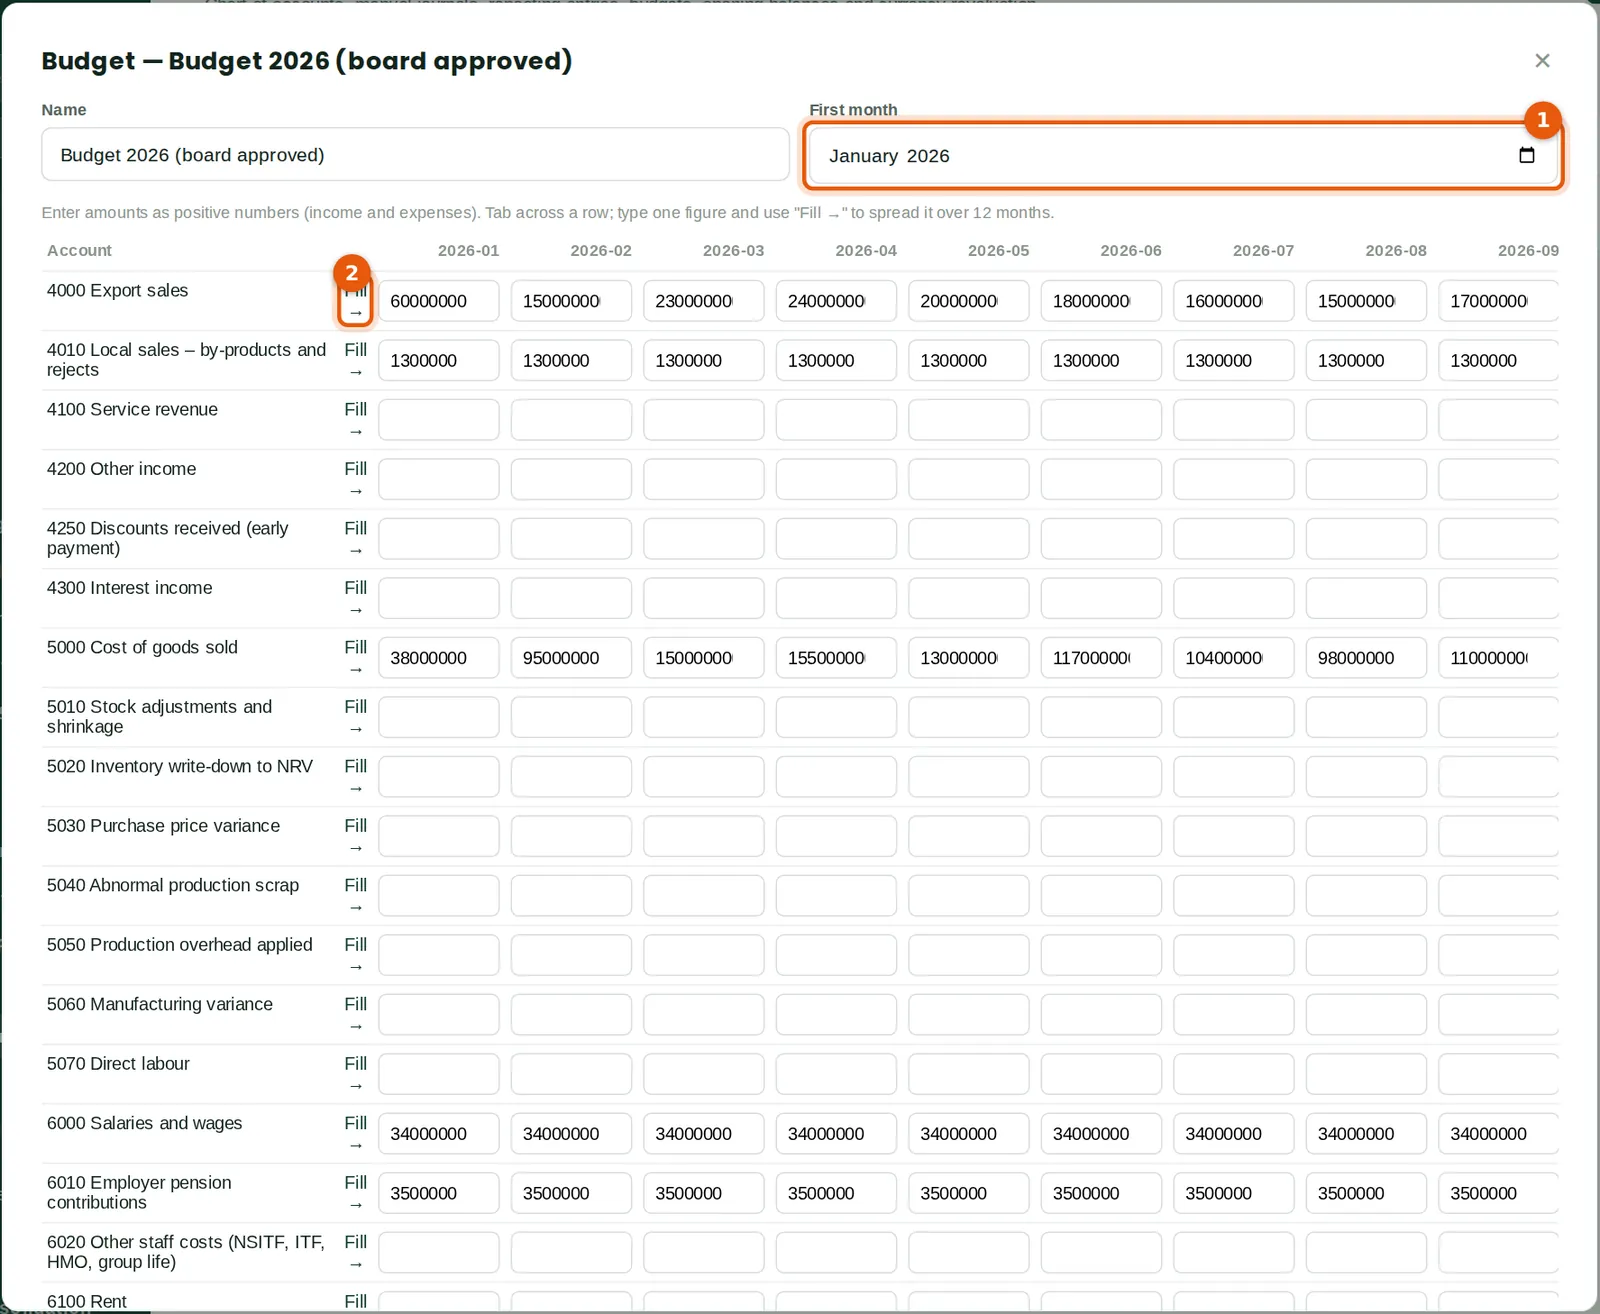
Why
A budget is a set of monthly amounts for each profit and loss account. Savannah Harvest's board approved its 2026 budget in January; Funmilayo entered it in Chart & journals → Budgets. Budgets can also be imported from a spreadsheet.
Who
Finance manager or accountant.
What to do
- Click New budget, give it a name and choose the first month (1).
- Type the amount for each account and month. To spread one figure over the year, type it in the first month and click Fill → (2).
- Save the budget.
12.16 Budget against actual
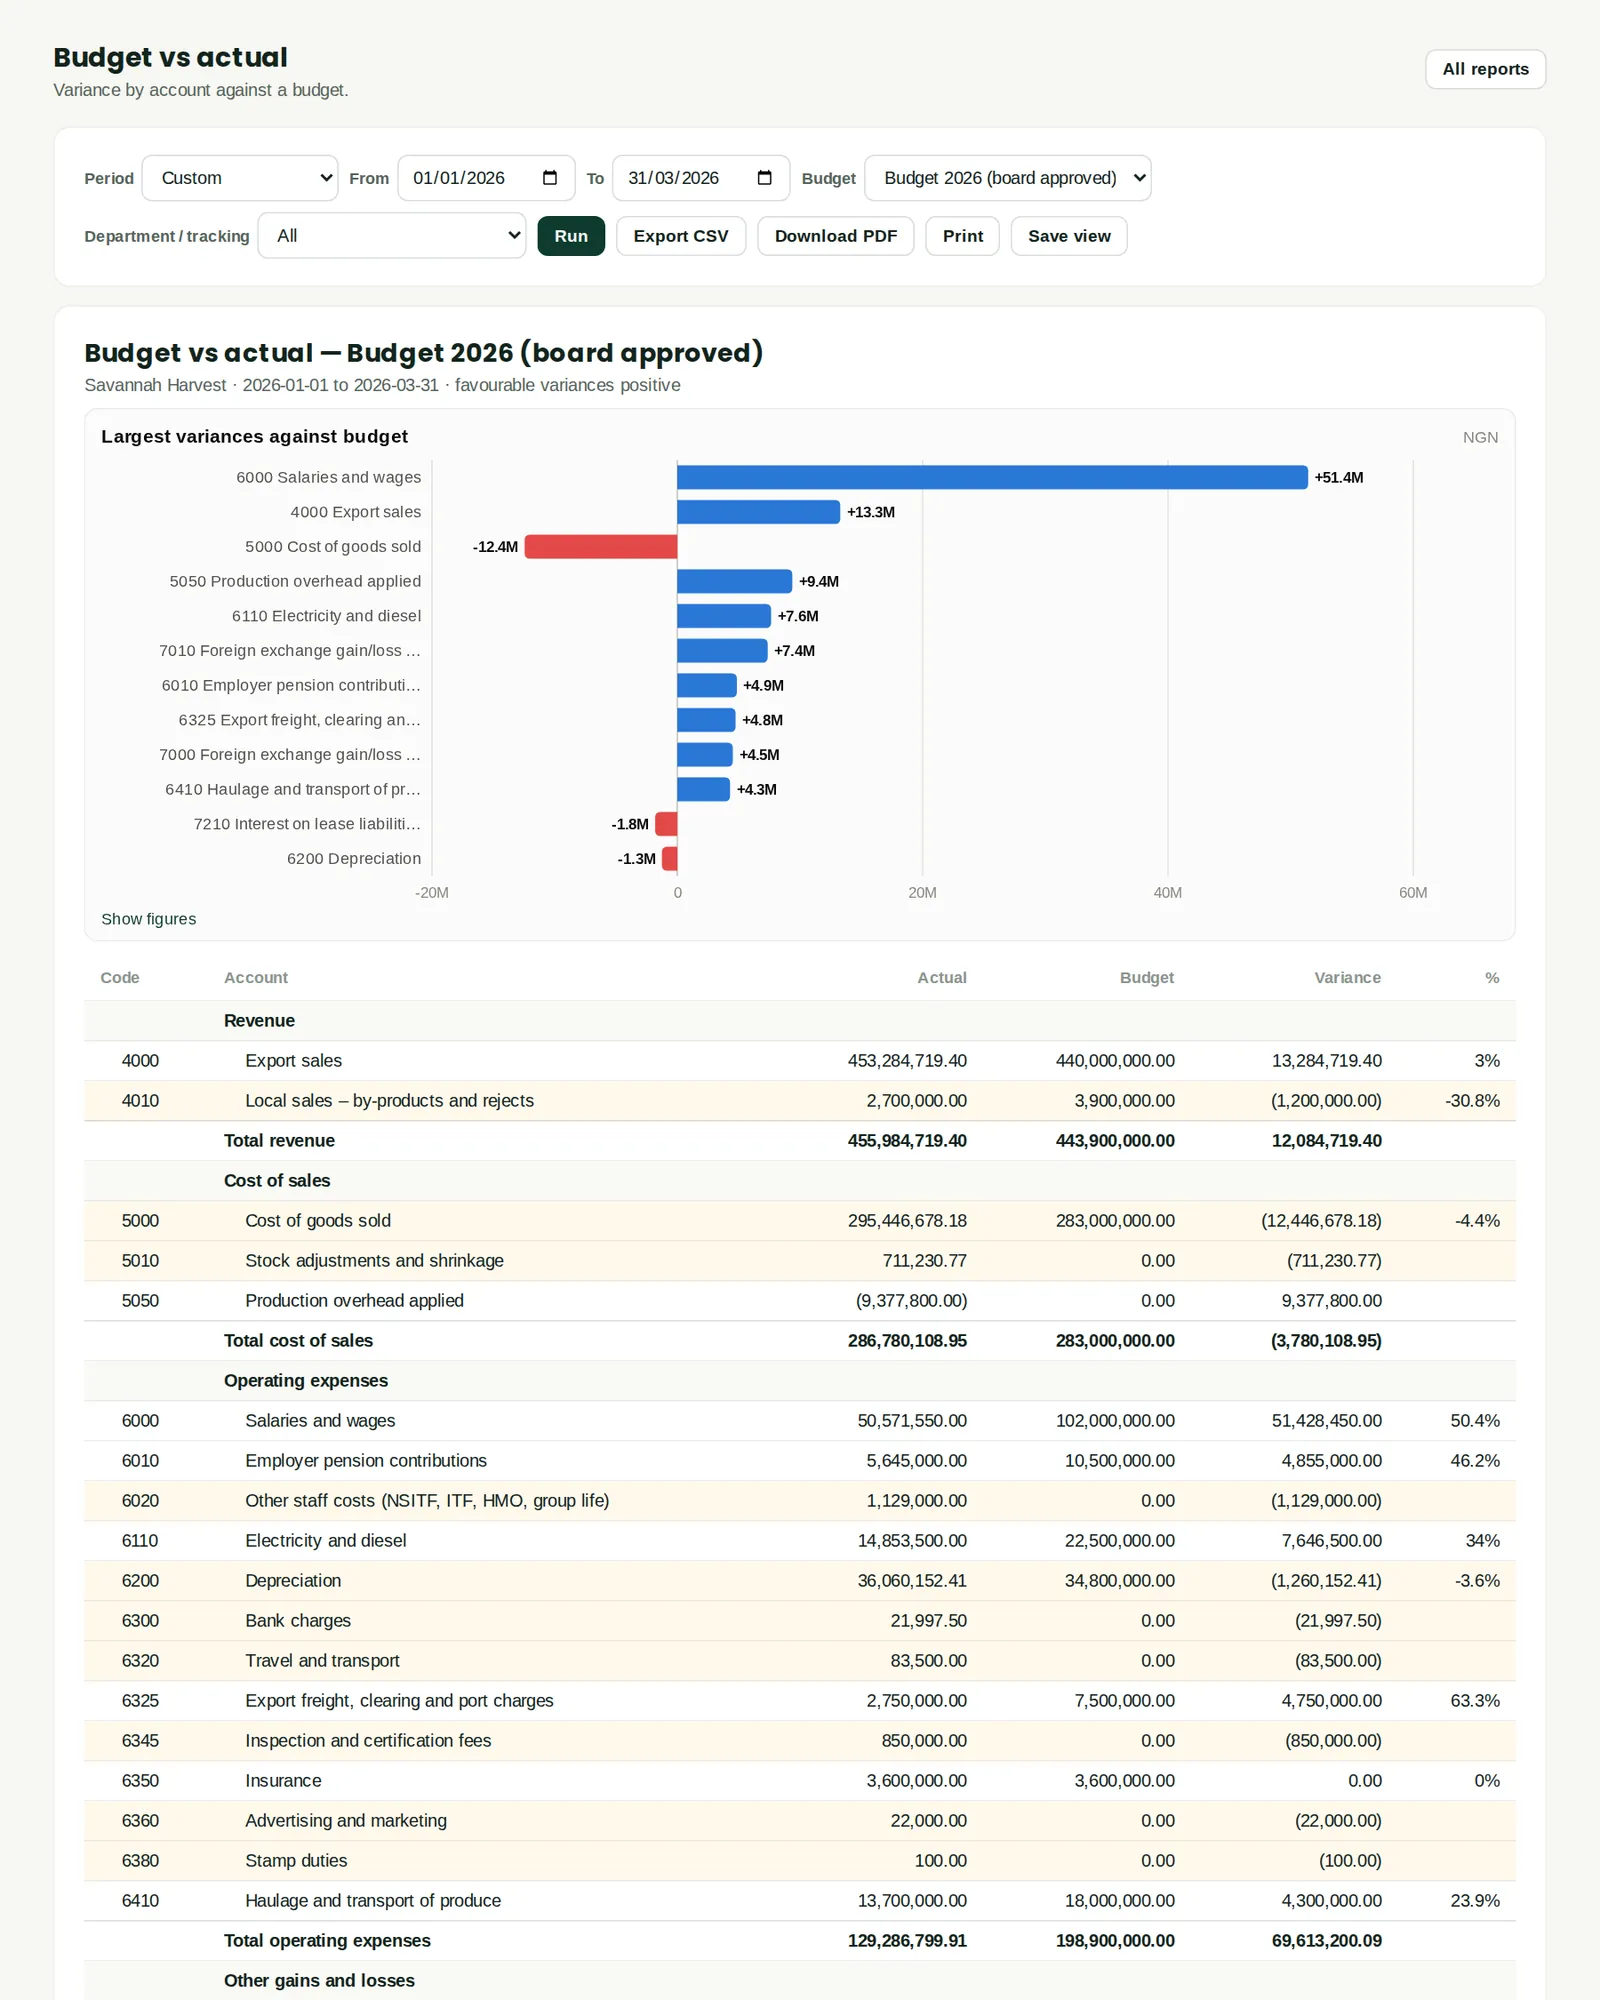
Why
Actual figures against the budget for each account, with the variance in naira and per cent. Favourable variances are positive. The chart at the top shows the largest variances. For Savannah Harvest, export sales are ahead of budget for the quarter, while cost of goods sold is higher with them.
Who
Finance manager, owners.
What to do
- Open Reports → Budget vs actual, choose the period and the budget, and click Run.
12.17 Copy a budget for a reforecast
Why
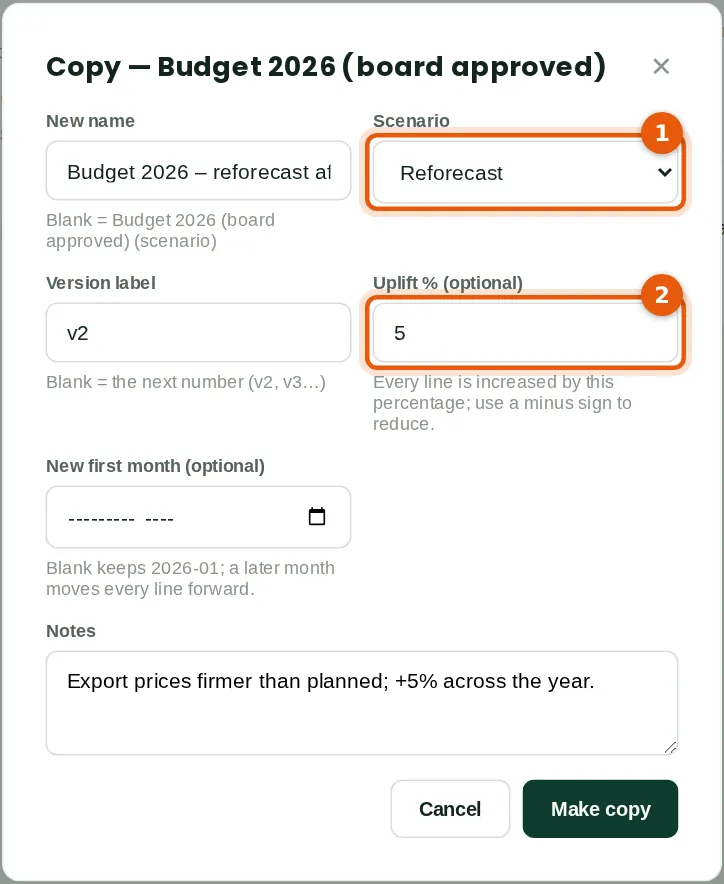
A budget can have versions and scenarios — base, best case, worst case or reforecast — so the approved budget stays unchanged while you plan. A copy can raise or lower every line by a percentage. After the first quarter, Chukwudi made a reforecast with export prices 5% higher.
Who
Finance manager.
What to do
- In Budgets & planning, click Copy on the budget.
- Choose the scenario (1), type a version label and, if needed, an uplift percentage (2). Add a note on the reason. Click Make copy.
- Edit the copy's lines if you need to.
12.18 Budget versions
Why
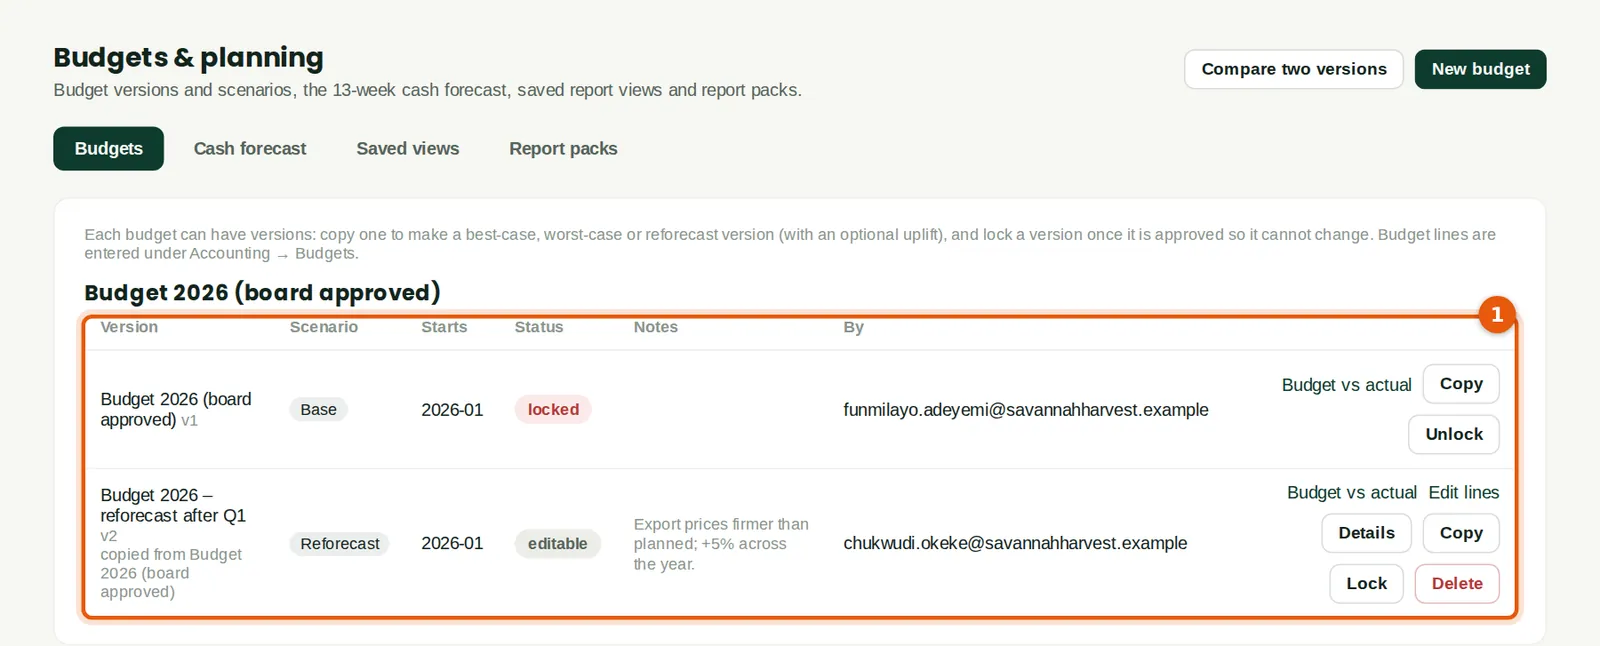
The list shows each version with its scenario, first month and status (1). Once the board has approved a budget, lock it so it cannot be changed; Savannah Harvest's approved budget is locked and the reforecast is still editable. Compare two versions shows them side by side with actuals to date.
Who
Finance manager; an owner or administrator locks an approved budget.
What to do
- Use Lock or Unlock on a version, Budget vs actual to run the report, and Compare two versions to put two versions side by side.
12.19 13-week cash-flow forecast
Why
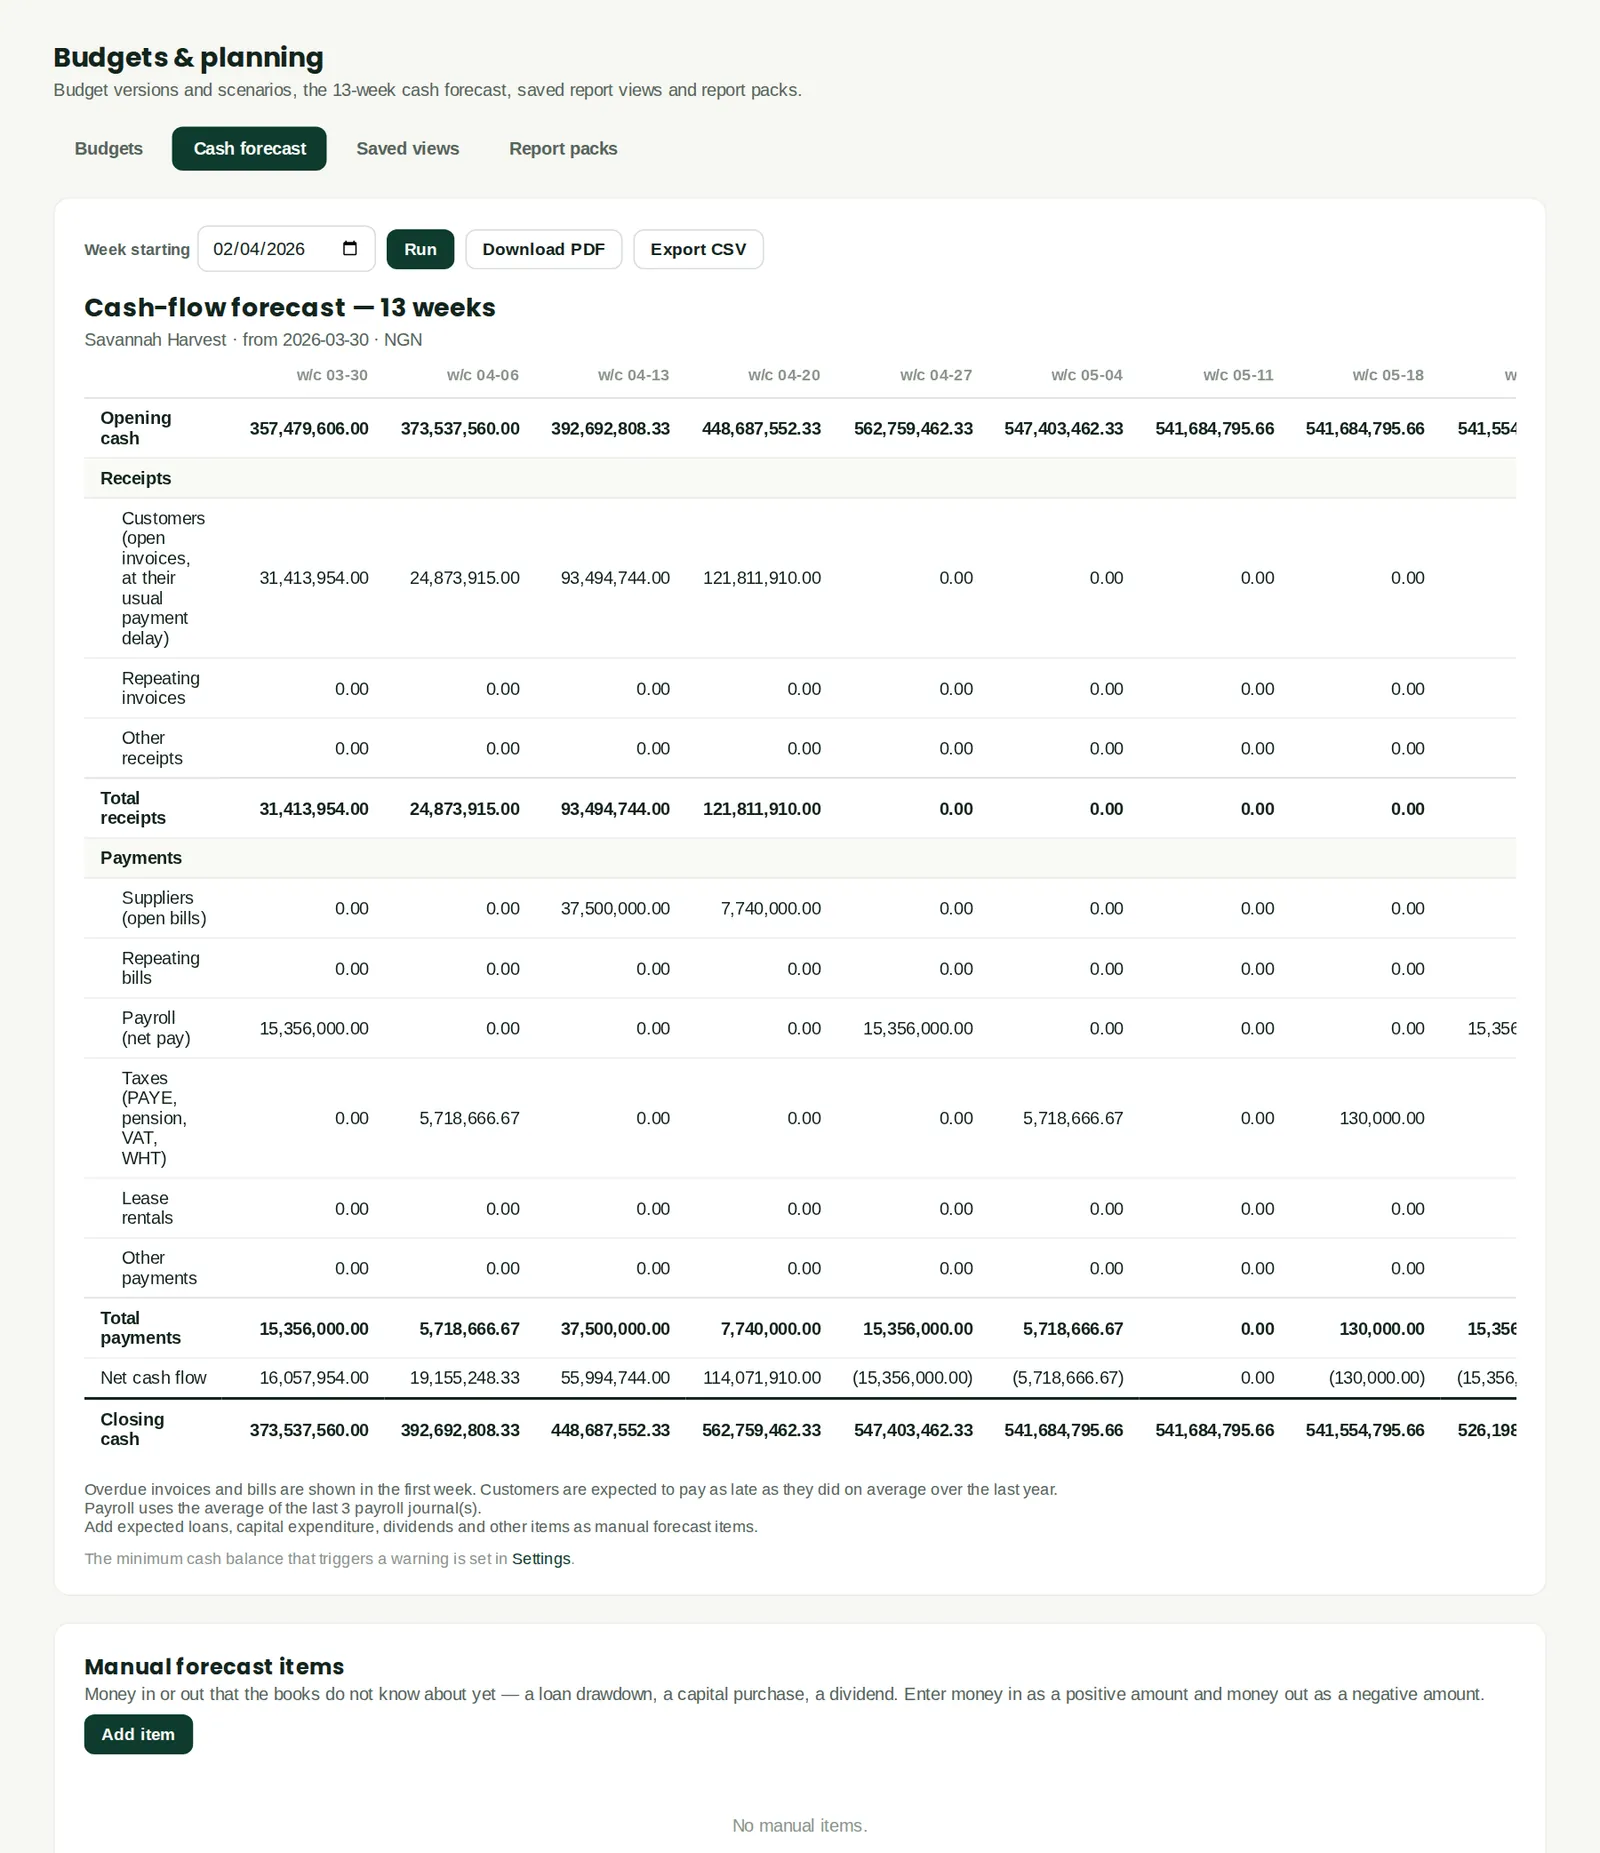
Cash for the next 13 weeks: open invoices expected at each customer's usual payment delay, bills at their due dates, repeating transactions, payroll (from the average of recent payroll journals), taxes, lease rentals and any manual items. Overdue items fall in the first week. A warning shows when cash falls below the minimum set in Settings.
Who
Finance manager.
What to do
- Choose the week to start from and click Run.
- Under Manual forecast items, add money in or out the books do not know about yet — a loan drawdown, a capital purchase or a dividend.
12.20 Report packs
Why
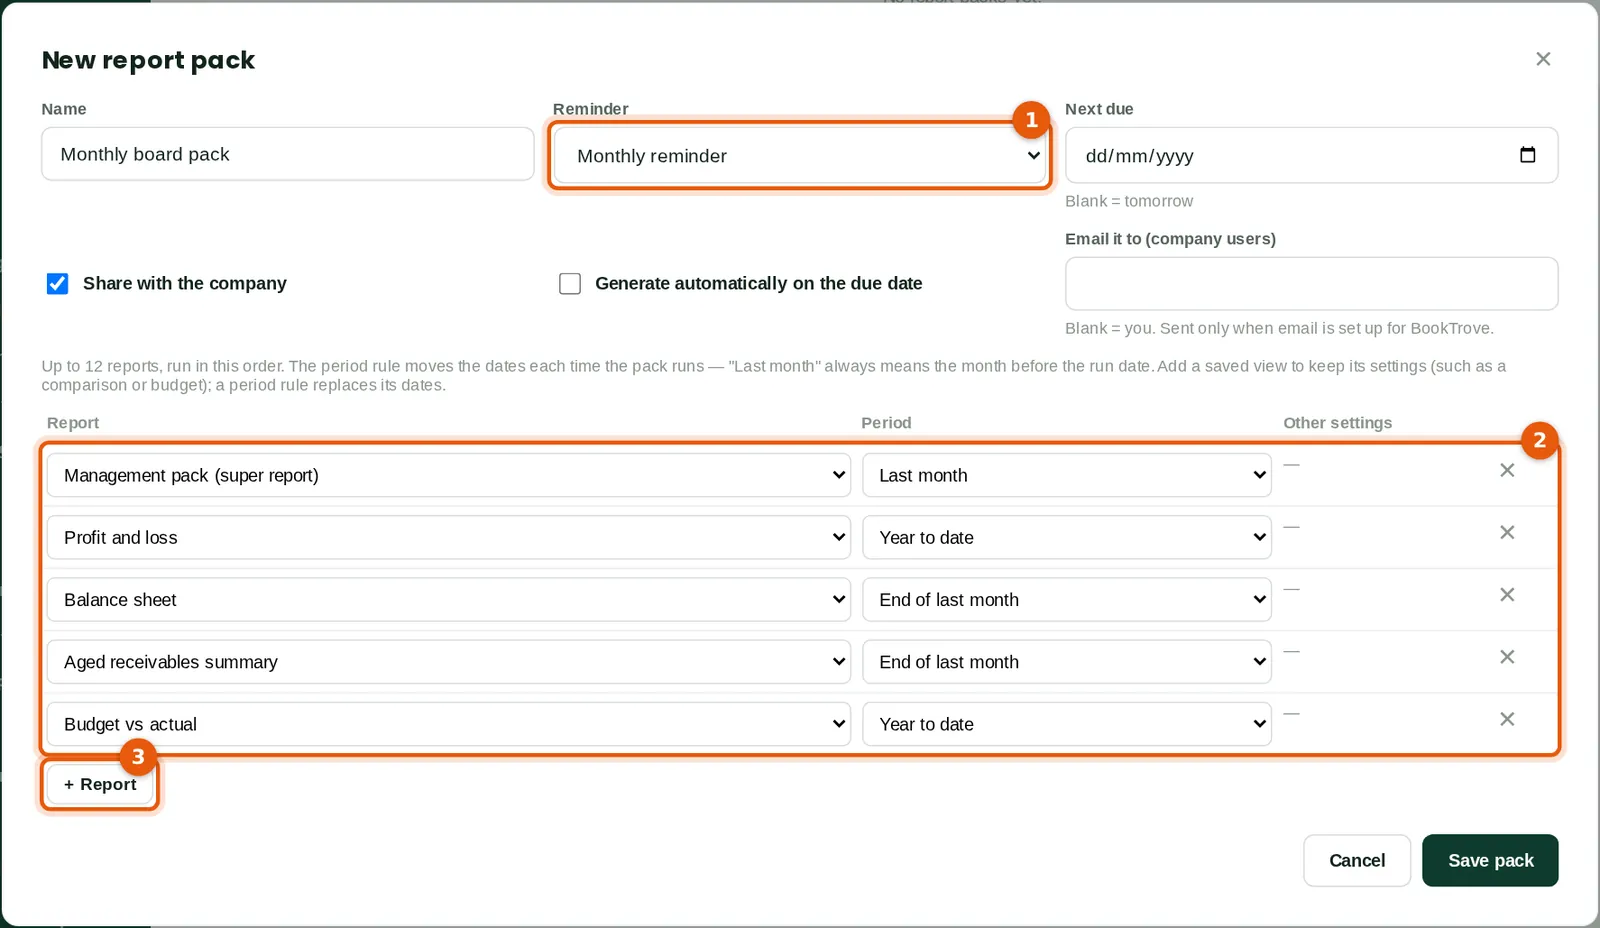
A report pack runs several reports in order with one click, and can remind you when it is due. Each report has a period rule, so "Last month" always means the month before the day the pack runs. A pack can be shared with the company and emailed to company users.
Who
Finance manager.
What to do
- In Budgets & planning → Report packs, click New report pack and name it.
- Choose a reminder (1): Monthly reminder puts the pack on everyone's To do list when it is due.
- Click + Report (3) for each report, then choose the report and its period rule (2). Up to 12 reports.
- Save the pack. Run it from the list and download it as one PDF.
12.21 Save a report view
Why
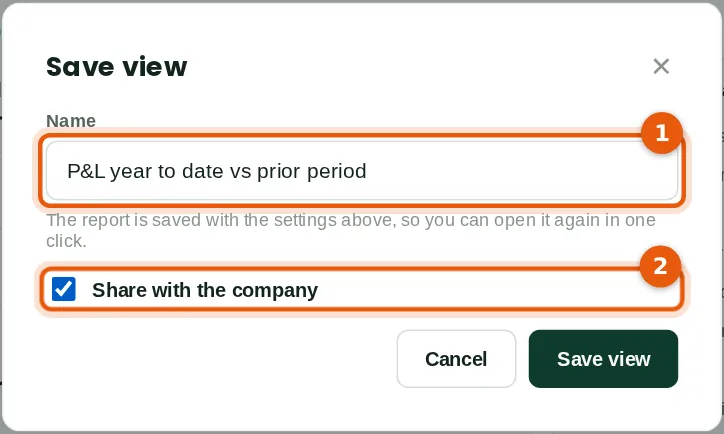
A saved view keeps a report with its settings — period rule, comparison, columns, budget — so it can be run again with one click or added to a report pack. A shared view is available to everyone in the company who can run that report.
Who
Anyone who can run the report.
What to do
- Set up the report, click Save view, type a name (1), tick Share with the company (2) if others need it, and save.
12.22 Saved views
Why
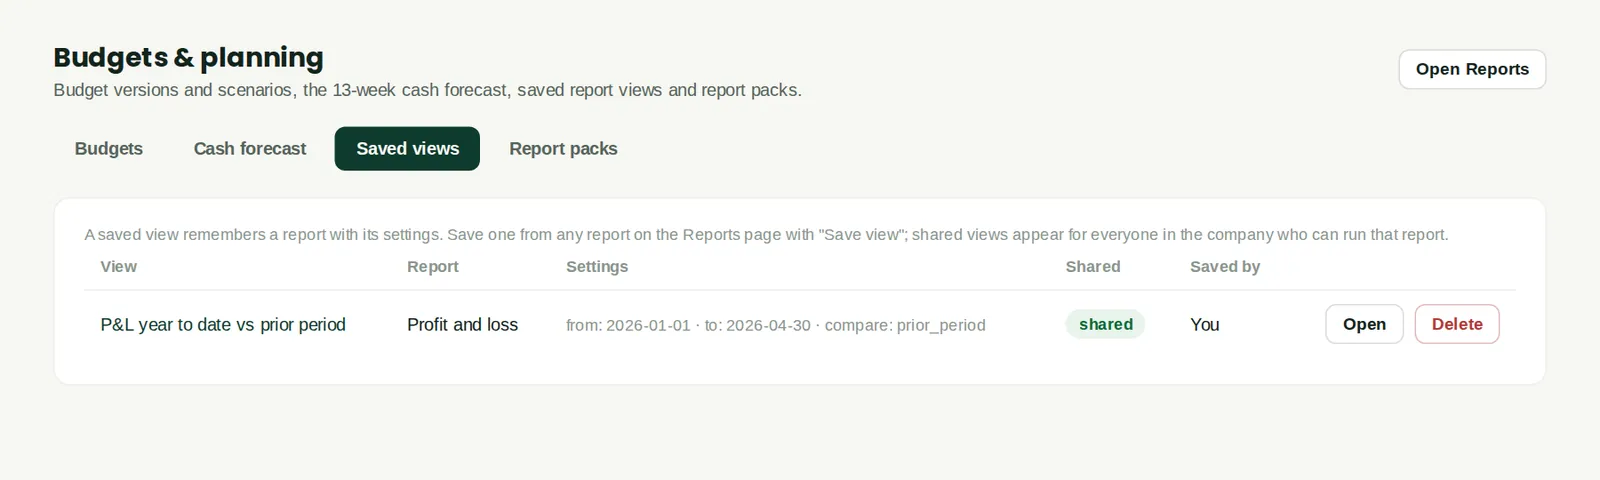
The saved views with their report, settings, whether shared and who saved them. Open runs the view; the person who saved it can delete it.
Who
Anyone with report access.
12.23 The report packs
Why
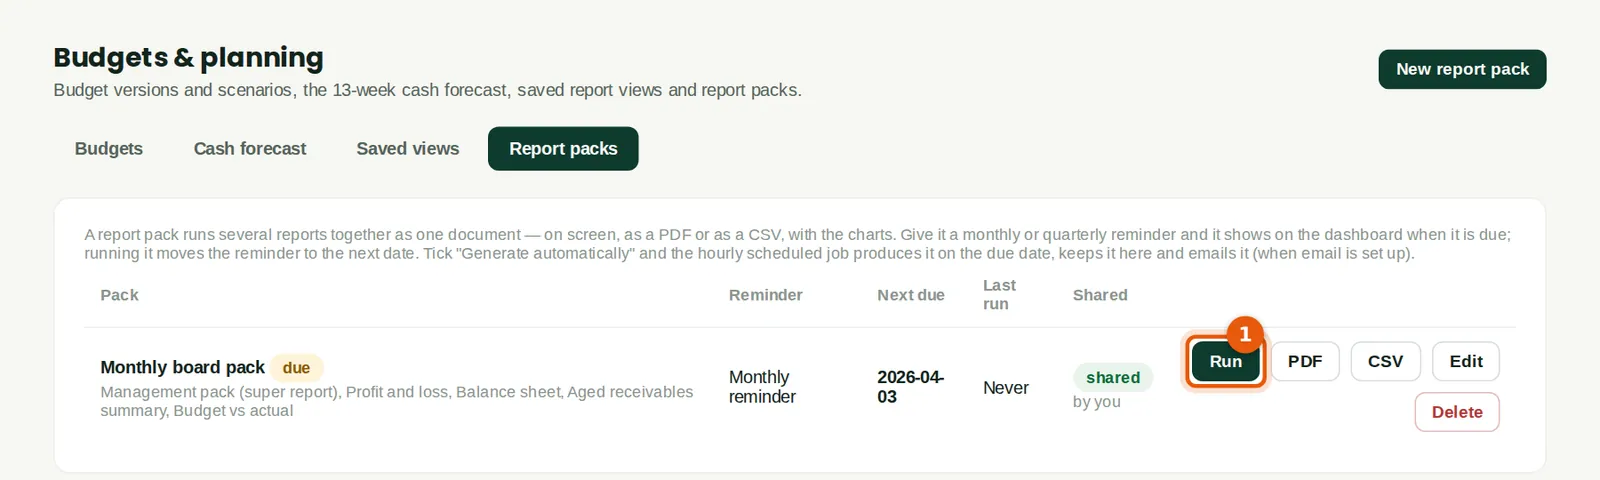
Each pack with its reports, reminder and next due date. A pack that is due appears on the To do list.
Who
Finance manager.
What to do
- Click Run (1) to run a pack, or Edit to change it. Download PDF produces the whole pack as one document.
12.24 A report pack run
Why
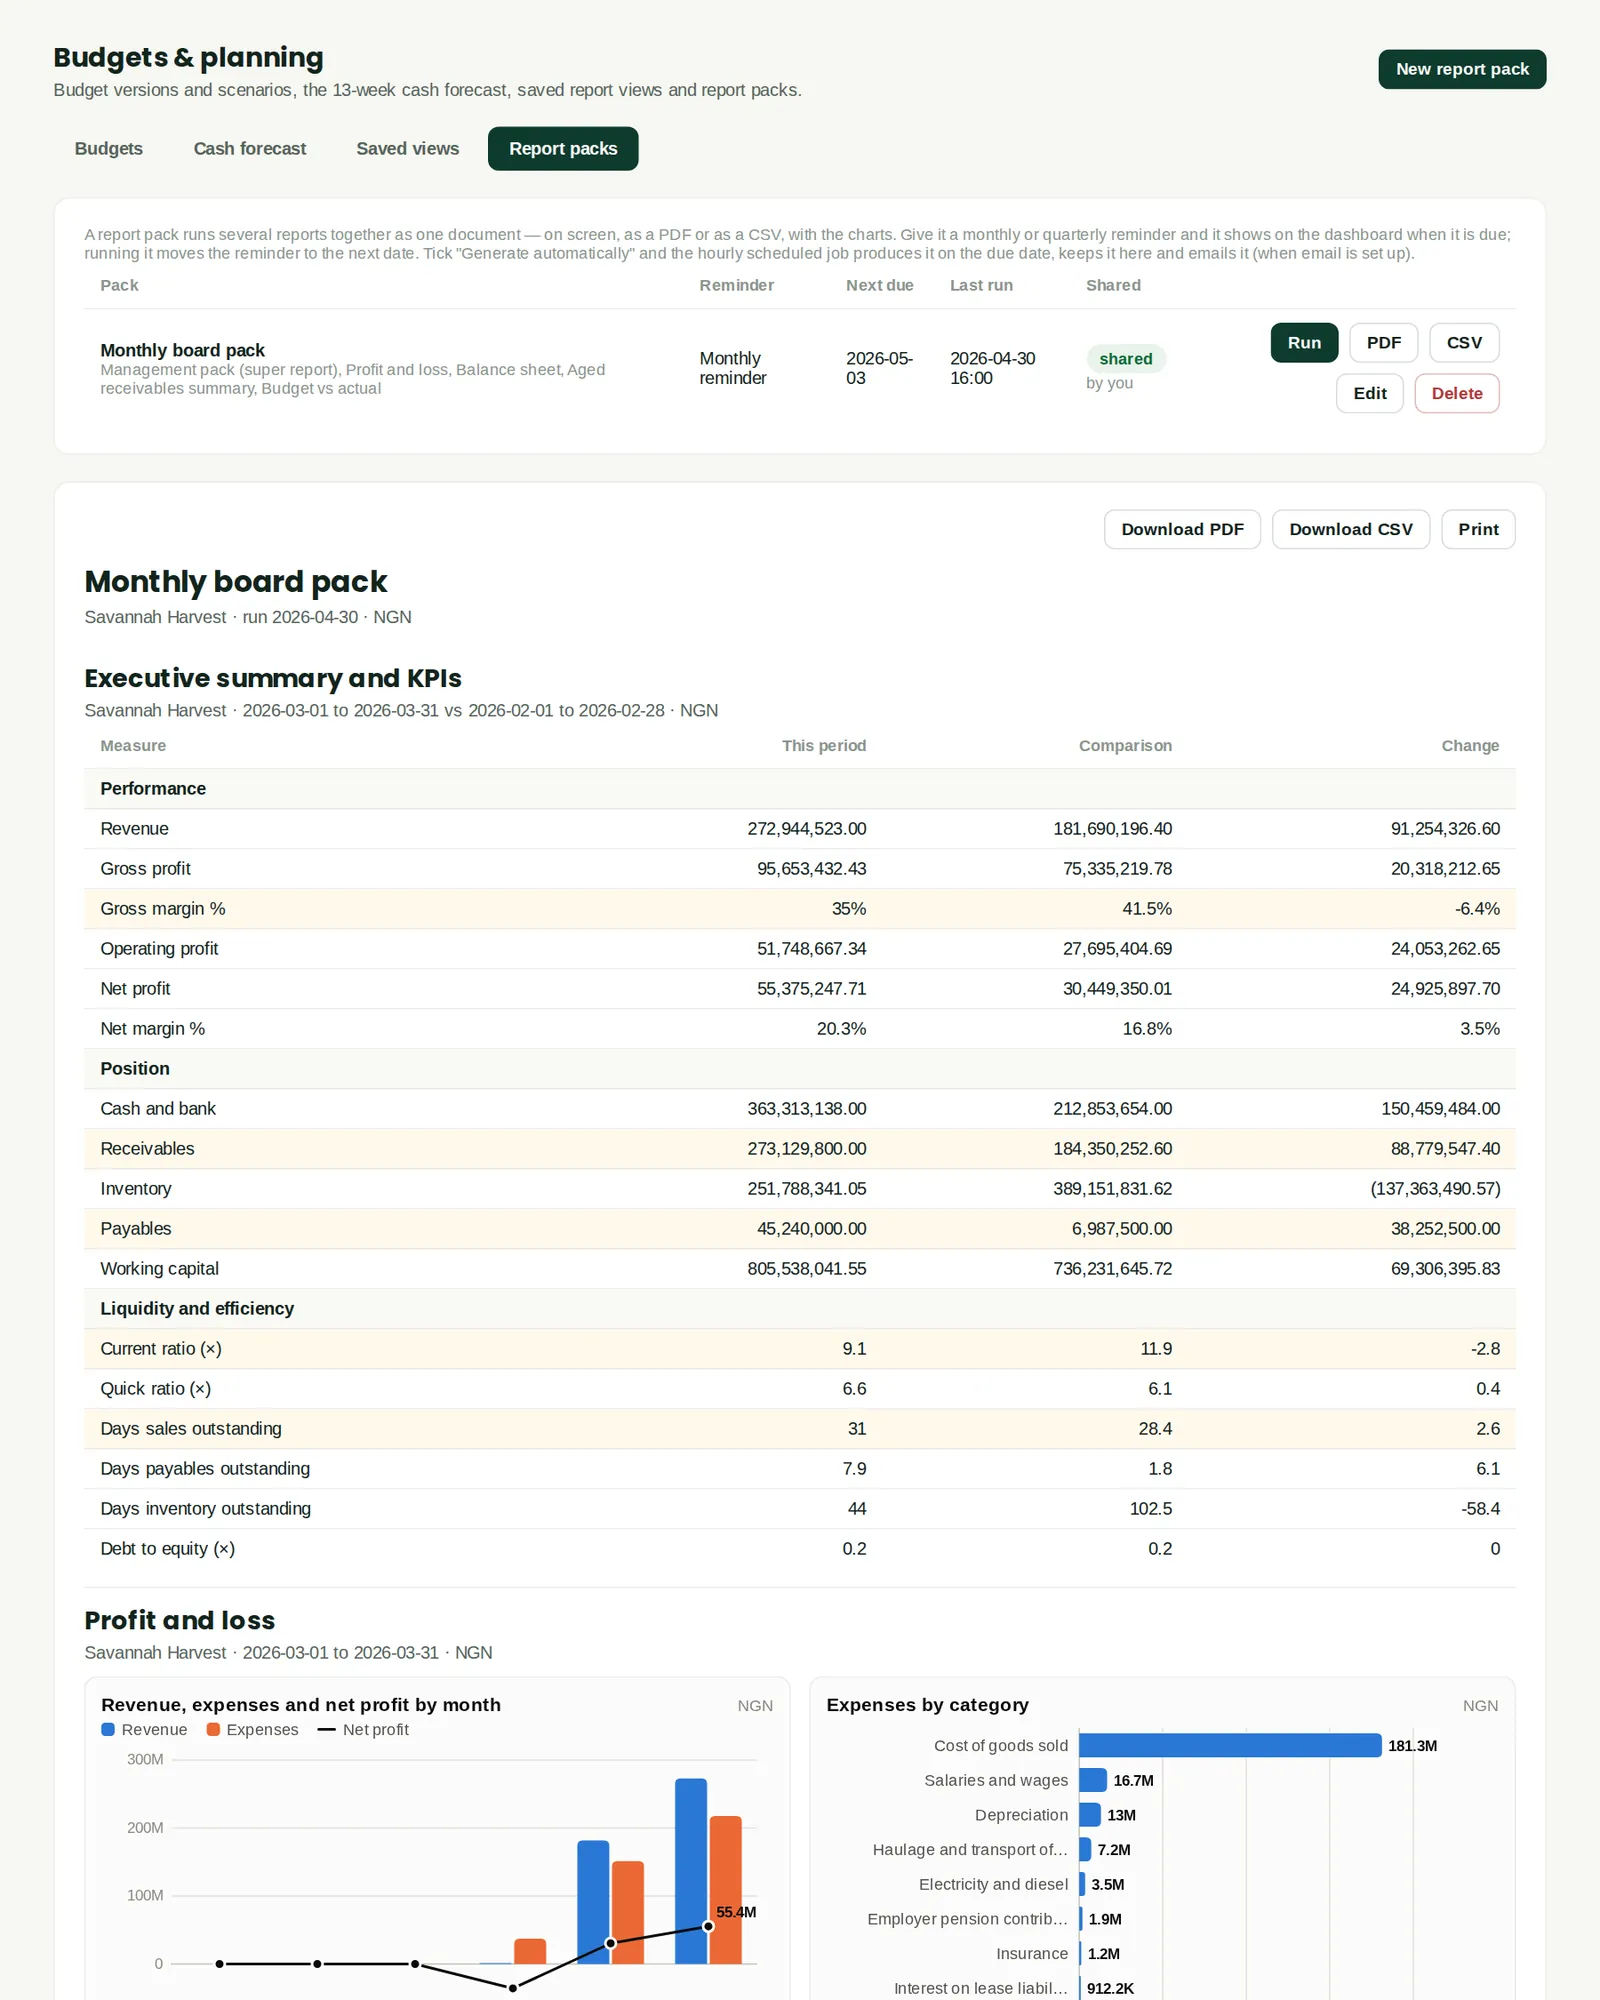
The reports run one after the other with the pack's period rules — here the management pack and balance sheet for last month (March 2026) and the profit and loss and budget comparison for the year to date. Download PDF, Download CSV or Print.
Who
Finance manager, for the board.